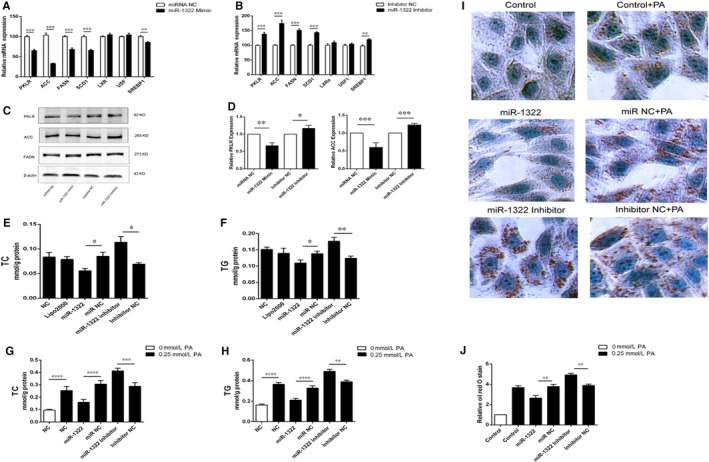
Figure 3.

Effect of miR‐1322 in HepG2 cells. Overexpression (A) or inhibition (B) of miR‐1322 alters the mRNA expression of the downstream genes of ChREBP. Western blot analysis and (C) ImageJ quantification of their protein levels (D). Cholesterol (E) and triglyceride (F) levels of HepG2 cell lysis. With the palmitate intervention, cholesterol (G) and triglyceride (H) levels of HepG2 cell lysis and Oil Red O staining analysis of HepG2 cells (I and J). PKLR, pyruvate kinase L/R; ACC, acetyl‐CoA carboxylase; FASN, fatty acid synthase; SCD1, stearoyl‐CoA desaturase 1; LXRα, liver X receptor α; USF1, upstream transcription factor 1; SREBP1, sterol regulatory element‐binding protein 1. P < 0.05 (*), P < 0.01(**)
