Figure 1.

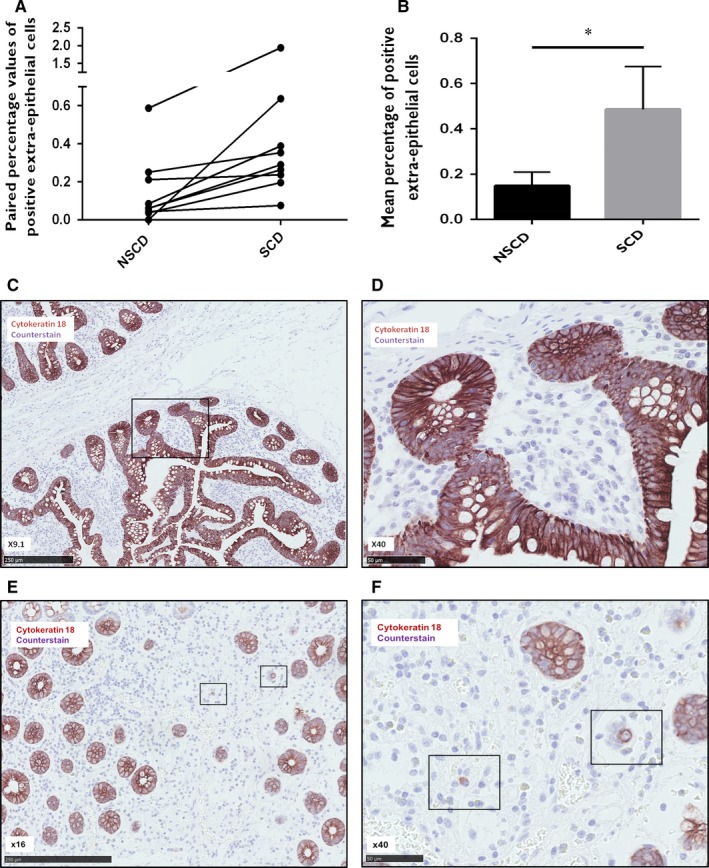
Cytokeratin‐18 immunohistochemical analysis. Nine paired FFPE samples of strictured and non‐strictured intestinal tissue from patients with Crohn's disease (CD) were stained for cytokeratin‐18. Image J was used to analyse the number of extra‐epithelial cells within the lamina propria and submucosa positive for cytokeratin‐18 as a proportion of the total number of cells within 3 randomly selected high power fields per section. Panel A shows the paired percentage values of extra‐epithelial cells positive for cytokeratin‐18 staining in non‐strictured and strictured samples. Panel B shows the mean percentage of extra‐epithelial cells positive for cytokeratin‐18 staining in strictured and non‐strictured tissue. There is a significant increase in the number of positive extra‐epithelial cells in strictured tissue (P = 0.043). Bars represent standard error of the mean (SEM). Panels C‐F, representative images of immunohistochemical staining demonstrating specific positivity for cytokeratin‐18 within the epithelium of non‐strictured (C, ×9.1; B, ×40) and strictured (E, ×16; F, ×40) intestinal sections from patients with fibrostenosing CD. Panel D shows the area highlighted in panel C by the black rectangle at a higher power magnification. Panels C and D demonstrate the lack of extra‐epithelial staining of cytokeratin18 in a representative non‐strictured intestinal sample. Panel F shows the area highlighted in panel E by the black rectangle at a higher power magnification. Panels E and F are representative images from strictured intestinal samples demonstrating two positive cellular extra‐epithelial staining patterns of cytokeratin18: membranous and cytoplasmic
