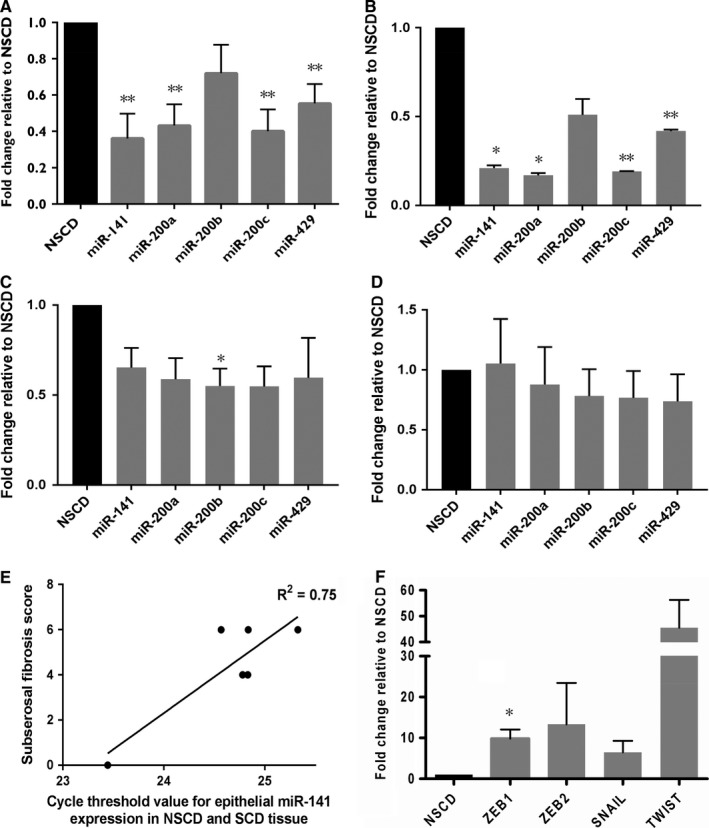
Figure 3.

MiR‐200 family and EMT transcription factor expression in strictured and non‐strictured Crohns disease small intestine. Panel A, MicroRNA‐200 family expression assessed using RT‐qPCR on RNA extracted from eight matched paired NSCD (black) and SCD (grey) tissue samples. Fold changes of normalised expression of each of the five members of the miR‐200 family in SCD samples compared to NSCD samples is shown. Fold changes were calculated using the 2−δδCT method. Four of the five members of the miR‐200 family were significantly down‐regulated: miR‐141 (P = 0.0022), miR‐200a (P = 0.0017), miR‐200c (P = 0.0015) and miR‐429 (P = 0.0042). Bars represent mean values with standard error. **P < 0.01. Panel B‐D, MiR‐200 family expression by tissue compartment. Panel B shows fold change of normalised expression of each of the five members of the miR‐200 family in the epithelial compartment of SCD samples compared to NSCD samples. Four of the five members of the miR‐200 family were significantly down‐regulated: miR‐141 (P = 0.0151), miR‐200a (P = 0.01310), miR‐200c (P = 0.0015) and miR‐429 (P = 0.0080). Panel C shows fold change of normalised expression of each of the five members of the miR‐200 family in the submucosal compartment of SCD samples compared to NSCD samples. MiR‐200b was found to be significantly down‐regulated in SCD samples in this compartment (P = 0.0432). No other member of the miR‐200 family was significantly differentially expressed. There was no significant difference found in the expression of any member of the miR‐200 family within the smooth muscle compartment (D). Fold changes were calculated using the 2−δδCT method. Bars represent mean values with standard error. * P < 0.05, ** P < 0.01. Panel E, correlation between subserosal fibrosis score and epithelial expression of miR‐141 in CD small intestinal tissue. The combination of subserosal fibrosis extent and severity (the subserosal fibrosis score) as assigned by an independent expert gastrointestinal histopathologist blinded to clinicopathological details are plotted against the Ct values of miR‐141 in six samples of SCD and NSCD intestinal tissue. A positive correlation is observed (R² = 0.75, P = 0.02). Panel F, EMT transcription factor expression. RT‐qPCR was performed on RNA extracted from eight matched sample pairs of strictured (grey bars) and non‐strictured (black bar) small intestinal tissue from patients with fibrostenosing CD. Fold changes were calculated using the 2−δδCT method normalised to GAPDH. ZEB1 was found to be significantly up‐regulated (P = 0.035). Three other transcription factors were not significantly up‐regulated: ZEB2 (P = 0.259), SNAIL (P = 0.101), TWIST (P = 0.173). Bars represent mean standard error. *P < 0.05
