
Figure 4.
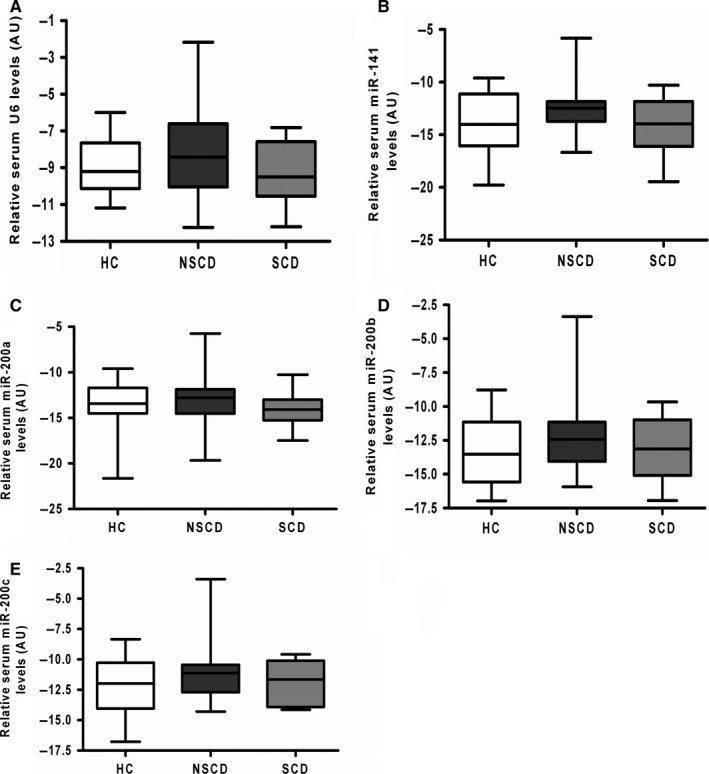
Serum expression profiles of the miR‐200 family in patients with Crohn's disease and healthy controls. MiRNAs were extracted from sera from patients with stricturing CD (SCD; n = 10), non‐stricturing CD (NSCD; n = 23) and healthy controls (HC; n = 12). Box and whisker plots demonstrate relative expression of U6 (A), miR‐141 (B), miR‐200a (C), miR‐200b (D) and miR‐200c (E). One way ANOVA testing revealed no significant differences between the clinical groups for any member of the miR‐200 family nor the control U6. Mir‐429 was excluded from this analysis as correlation between duplicate readings was poor. AU, arbitrary units; HC, healthy controls; NSCD, non‐stricturing Crohn's disease; SCD, stricturing Crohn's disease