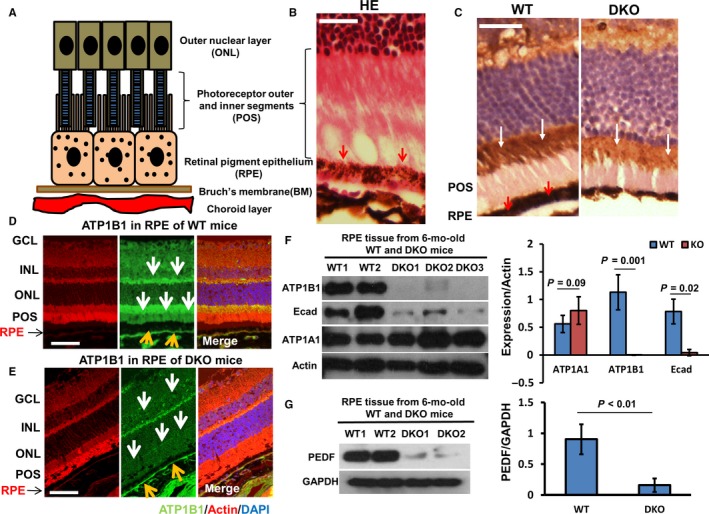
Figure 3.

Down‐regulation of ATP1B1, E‐cad and PEDF expression in RPE of DKO mice. A, Schematic diagram of RPE and associated structures. B, RPE, photoreceptor outer and inner segments (POS) and outer nuclear layer (ONL) stained with haematoxylin and eosin (HE), and the pigment particles in RPE are outlined by red arrows. C, Left panel, in RPE (red arrows) and POS, the ATP1B1 was stained by IHC (immunohistochemistry) to show the black particles in RPE and POS (white arrows). Right panel, IF (immunofluorescent staining) showed that the reduced ATP1B1 (highlighted by white arrow) located at the POS in DKO mice. D, In WT, the expression of ATP1B1 was presented by IF staining (white and yellow arrow). E, In DKO mice, ATP1B1 expression was reduced significantly on the apical side of RPE, POS and GCL (yellow and white arrows). F, Western blots showed that the expression of ATP1B1 and E‐cad was reduced markedly, but that ATP1A1 expression was not reduced in RPE of 6‐mo‐old DKO mice. Actin is loading control. G, Western blots showed that the expression of PEDF was down‐regulated in RPE of 6‐mo‐old DKO mice. GAPDH is loading control. The histograms in F and G show the relative intensities of ATP1A1, ATP1B1, E‐cad, PEDF expressed as a ratio with respect to the loading control (n = 4 in WT and DKO each) GCL, ganglion cell layer; INL, inner nuclear layer; IPL, inner plexiform layer; INL, inner nuclear layer; ONL, outer nuclear layer; POS, photoreceptor outer and inner segments. Bar is 45 μm
