Figure 4.

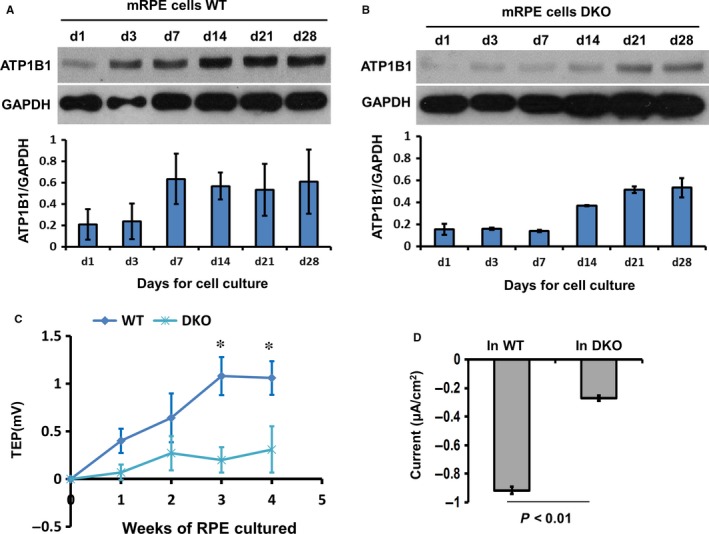
DKO RPE had reduced TEP and reduced expression of ATP1B1. A and B, Western blots show ATP1B1 expression was up‐regulated in WT RPE cells in 3 d. In DKO mice, the up‐regulation of ATP1B1 was delayed by at least 1 wk appearing only after 14 days in culture. GAPDH is loading control. The histograms in A and B show the relative intensity of ATP1B1 expressed as a ratio with respect to the loading control. C, Using transwell culture and Millicell ERS, the trans‐RPE electrical potential difference (TEP) was determined. At 3 wk in culture, the TEP was fourfold less in DKO RPE compared with WT (1.1 ± 0.2 mV WT and 0.25 ± 0.2 mV DKO, P < 0.05). D, After 3 wk in culture of RPE monolayers, electrical current was detected using SVET (Scanning vibrating electrode technology) which detects current flowing through the entire epithelial surface it scans. The average of electrical current was threefold greater in WT than in DKO mice (−0.9 ± 0.12 μA/cm2 and −0.28 ± 0.2 μA/cm2, respectively, d3). All results were from three or more independent experiments
