Figure 1.

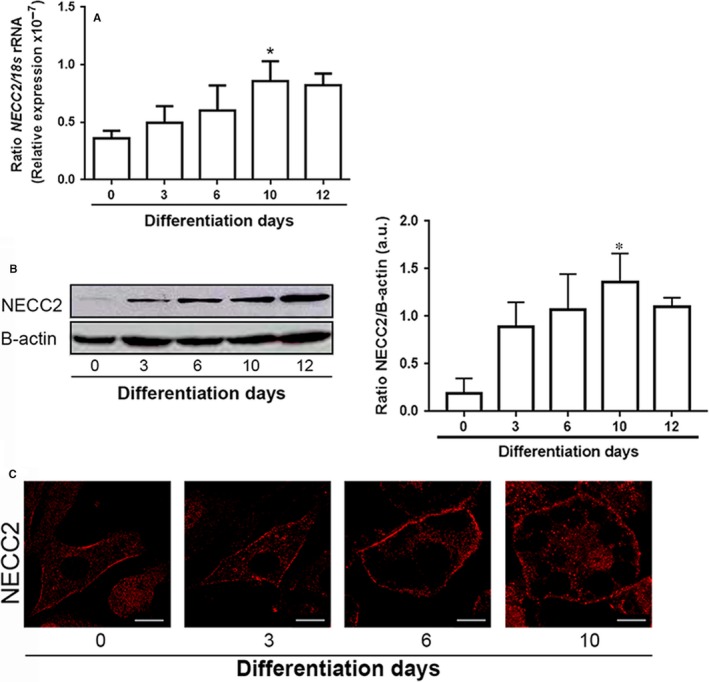
NECC2 expression and distribution during differentiation of 3T3‐L1 cells into adipocytes. A, Quantitative RT‐PCR analysis of Necc2 mRNA levels in 3T3‐L1 cells exposed to a hormonal differentiation cocktail for 0, 3, 6, 10 and 12 d. Gene expression was represented as ratio of target gene concentration to the concentration of a housekeeping gene, the 18s rRNA. Data represent the mean ± SEM of four independent experiments. Data were analysed for significance using paired‐samples t test. *P < 0.05 vs 0 d. B, Representative immunoblot of NECC2 protein content in 3T3‐L1 cell extracts during differentiation. B‐actin immunosignal was used as reference for protein charge. The graph shows the mean ± SEM from 5 independent experiments. Data were analysed for significance using paired‐samples t test. *P < 0.05 vs 0 d. C, Representative confocal images of 3T3‐L1 cells immunolabeled for NECC2 during differentiation. Scale bar 10 μm
