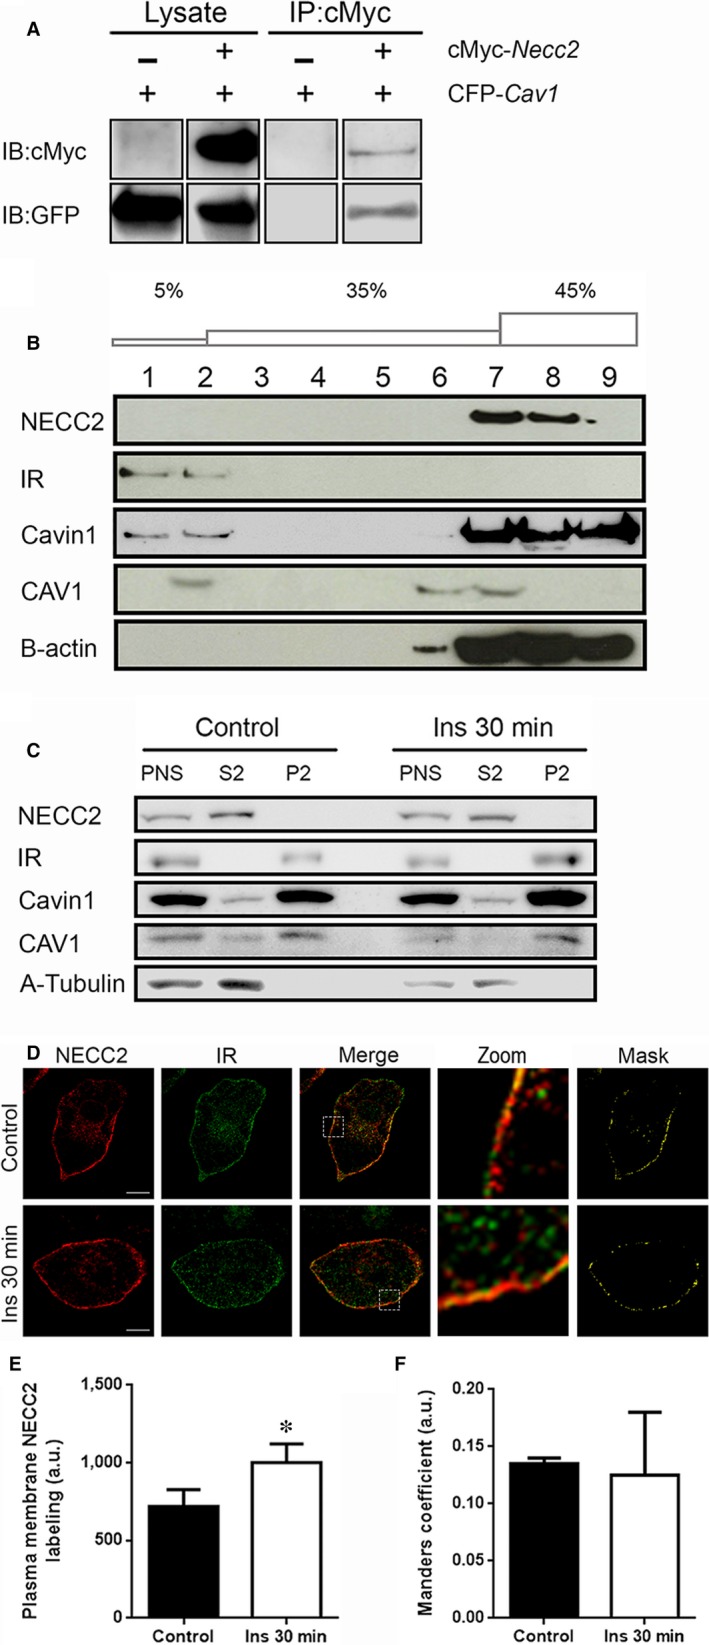
Figure 3.

Association of NECC2 with caveolae and its regulation by insulin in 3T3‐L1 adipocytes. A, Direct interaction between NECC2 with CAV1 revealed by co‐immunoprecipitation assay. Both lysates and immunoprecipitates (IP) were subjected to immunoblotting with anti‐cMyc and anti‐GFP antibodies. For each antibody, lanes were run on the same gel but were not contiguous (Figure S2). B, Caveolae‐enriched membranes from 3T3‐L1 adipocytes were isolated by using a detergent‐free method based on a discontinuous sucrose gradient (5‐35‐45% w/v). Distribution of endogenous NECC2, insulin receptor (IR), Cavin1, CAV1 and B‐actin were assayed by immunoblot. C, Post‐nuclear supernatant (PNS), cytosolic (S2) and crude membrane (P2) fractions from 3T3‐L1 adipocytes under basal conditions and treated with insulin (100 nmol/L) for 30 min were obtained by subcellular fractionation as described in Methods. Distribution of endogenous NECC2, IR, Cavin1, CAV1 and A‐Tubulin were analysed by immunoblot. All the experiments were repeated at least twice to confirm the results. D, Confocal microscope images of 3T3‐L1 adipocytes under basal conditions (top panels) or treated with insulin (100 nmol/L) for 30 min (bottom panels). After treatment, cells were co‐immunostained for NECC2 (red) and insulin receptor (IR) (green). Magnified insets (zoom) and binary masks are shown at the two most right panels. Scale bar 10 μm. E, Quantification of NECC2 immunosignal at the membrane level in untreated cells (Control) and in cells exposed to 100 nmol/L insulin (Ins 30 min). NECC2 immunolabeling was quantified for each experimental condition in at least 8 cells (n = 2), and expressed as arbitrary units (a.u.). (F) Mander′s coefficient (between NECC2 and IR) was calculated to quantify the degree of colocalization and represented as the mean ± SEM of at least 12 cells per experimental group (n = 2), and expressed as arbitrary units (a.u.). The graphs represent the mean ± SEM. Data were analysed for significance using paired‐samples t test. *P < 0.05 vs untreated cells (Control)
