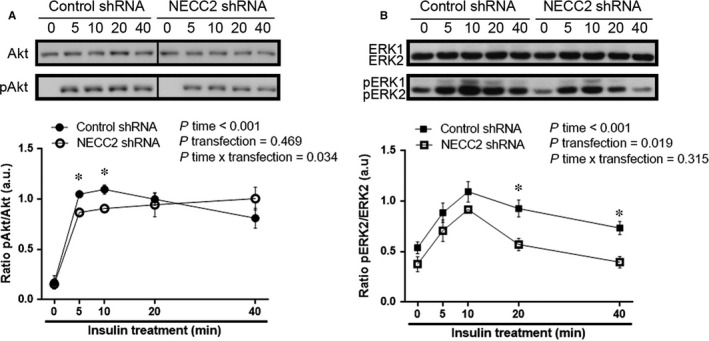
Figure 5.

Effect of endogenous NECC2 silencing on insulin signalling pathways. (A and B) 3T3‐L1 adipocytes were transiently transfected with a shRNA for Necc2 (NECC2 shRNA), or the empty vector (Control shRNA), pre‐treated 2 h with serum‐low differentiation media and treated with insulin (100 nmol/L) during the indicated time points. Immunoblotting were carried out with whole cells lysates and exposed to Akt and phospho‐Akt (pAkt) antibodies (A) or to ERK and phospho‐ERK (pERK) antibodies (B). Lanes were run on the same gel but were non‐contiguous in the Akt blot. Cropping line is used in the figure. Quantitative data were represented as ratio of pAkt vs Akt or pERK2 vs ERK2, respectively. Data represent the mean ± SEM of four independent experiments. Data were analysed using independent samples t test and RM‐ANOVA was used to calculate the time effect (P time), transfection effect (P transfection) and the time × transfection interaction (P time × transfection). *P < 0.05 vs corresponding time point of control shRNA cells
