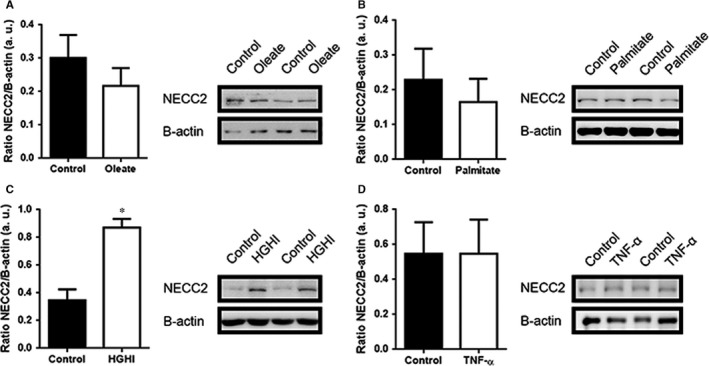
Figure 7.

In vitro assessment of NECC2 expression levels in response to different metabolic insults. (A‐D) 3T3‐L1 adipocytes under different metabolic insults known to induce adipocyte hypertrophy and/or insulin resistance states [(A) 500 μmol/L oleate (n = 10) and (B) 500 μmol/L palmitate (n = 4) for 18 h, (C) high‐glucose (25 nmol/L)/ high‐insulin (100 nmol/L) (HGHI) for 24 h (n = 8) and (D) 5 nmol/L high‐TNF‐α for 24 h (n = 4)]. Data were expressed as arbitrary units (a.u.). Results represent the mean ± SEM. Data were analysed using paired‐samples t test. *P < 0.05 vs Control
