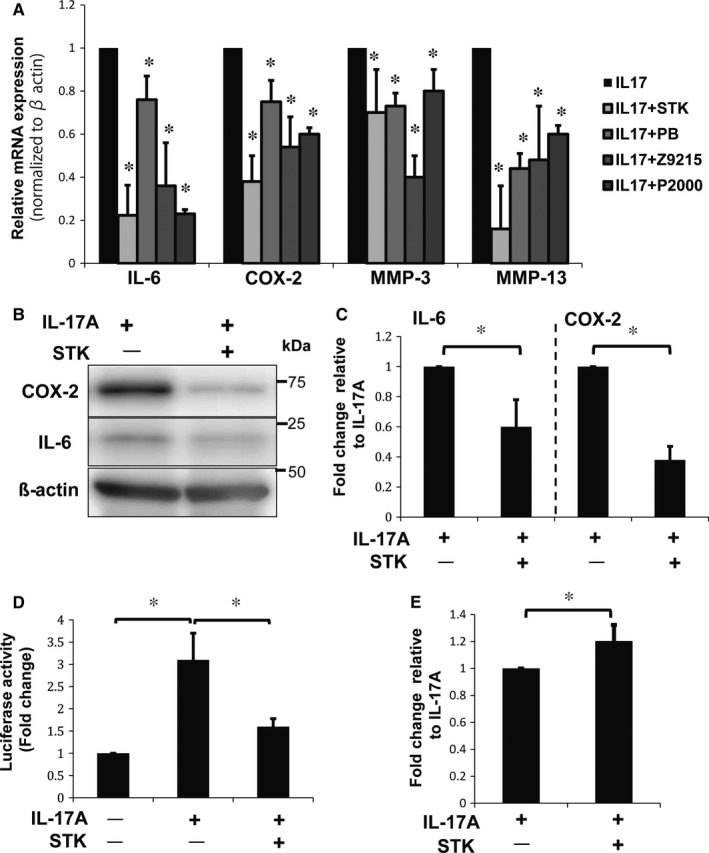
Figure 5.

Effects of treatment with IL‐17A and small‐molecule inhibitors on NP cells. A, Real‐time PCR analysis of NP cells treated with STK630921 (STK), Z92151850 (Z9215), PB203263256 (PB) and P2000N‐53454 (P2000). The inhibitors significantly reduced expression of IL‐6, COX‐2, MMP‐3 and MMP‐13 mRNA. Results shown as mean ± SD; n = 3; *P < 0.05. B, C, Western blot analysis of NP cells with STK treatment shows a reduction in IL‐6 and COX‐2 protein levels. Results shown as mean ± SD; n = 3; *P < 0.05. D, COX‐2 promoter assay showing a loss of COX‐2 transcriptional activity in NP cells treated with STK. Results shown as mean ± SD; n = 3; *P < 0.05. E, Alcian blue staining quantifying of NP cells treated with STK and IL‐17A. Optical density of the extracted dye was measured at 670 nm. Results shown as mean ± SD; n = 3, *P < 0.05
