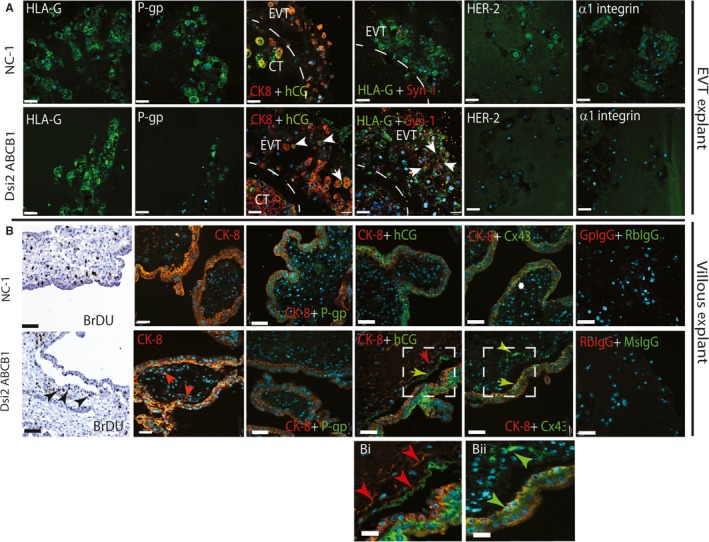
Figure 4.

Silencing of ABCB1 drives EVT and CT syncytial differentiation. A, Fluorescent and dual immunochemistry in serial sections shows the green HLAG‐positive EVT (or red CK8 in the hCG image) in combination with a panel of ST markers (hCG and Syncytin‐1) and EVT markers (HER2 and ITGA1). NC‐1‐treated EVT expresses both HER2 and ITGA1 but not hCG or Syncytin‐1, while Dsi2 ABCB1‐treated EVT up‐regulates hCG and Syncytin‐1 but does not express HER2 or ITGA1. B, Floating villous explants (10‐14w) were treated for 24 h with NC‐1 or Dsi2 ABCB1. Trophoblast proliferation was assessed by BrDU incorporation and trophoblast fusion by dual fluorescent IHC for cytokeratin CK8/18 (red) and P‐gp, Cx43 and hCG expression (green). In NC‐1 control explants, P‐gp (green) is expressed at the ST with staining extended to the apical CT surface, hCG (green) is expressed at the junction of CT and ST, and Cx43 (green) expression is limited to sites of CT fusion (asterisk). Silencing of ABCB1 results in separation of the ST, but residual BrDU‐positive CT remains on the villous surface in both CT and newly formed syncytium (black arrows). Formation of a new ST layer on the villous surface can also be observed in the CK8 image (red arrows). P‐gp staining is lost, while both hCG and Cx43 (green arrows) are induced in both the detached ST and newly forming CK‐positive CT‐ST. Magnified images shown in Bi and Bii correspond to the hatched boxes. Negative isotype controls of guinea pig and rabbit IgG or rabbit and mouse IgG showed no staining. Three placentas were used in experimental triplicates. Scale bars = 25 μmol/L and 100 μmol/L in Bi and Bii
