
Figure 2.
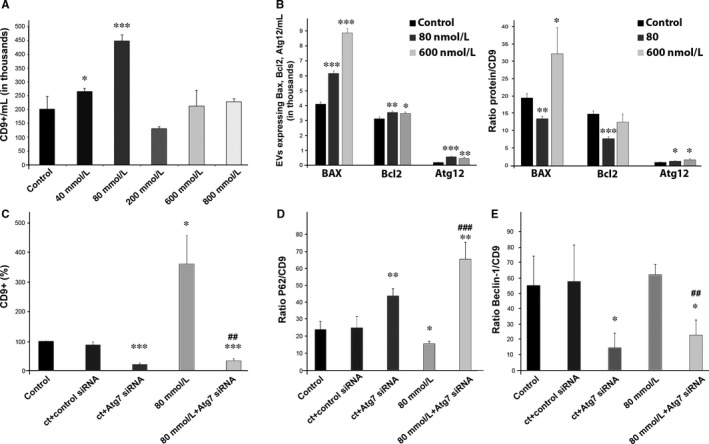
Release of EVs is increased in low‐stressed ARPE‐19 cells. A, Detection of EVs by flow cytometry. Exosomes are tracked using an antibody against CD9. B, Total number (left panel) and relative levels (right panel) of exosomes expressing Bax, Bcl‐2and Atg12 in ARPE‐19 cells untreated and treated with low and high EtOH concentration. C, Relative quantification of exosomes released from ARPE‐19 cells (control and stressed) after applying Atg7 siRNA. D, Relative levels of exosomes expressing p62, before and after applying Atg7 siRNA into control and stressed ARPE‐19 cell cultures. E, Relative levels of exosomes expressing Beclin‐1, before and after applying Atg7 siRNA into control and stressed ARPE‐19 cell cultures. Flow cytometry dot plots available in Figures S2 and S3. Values are expressed as mean ± SEM (N ≥ 3). Significance levels: (when compared to control) P < .05 (*), P < .01 (**) and P < .001 (***); (when compared to treated with 80 mmol/L group) P < .01 (##) and P < .001 (###)