
Figure 6.
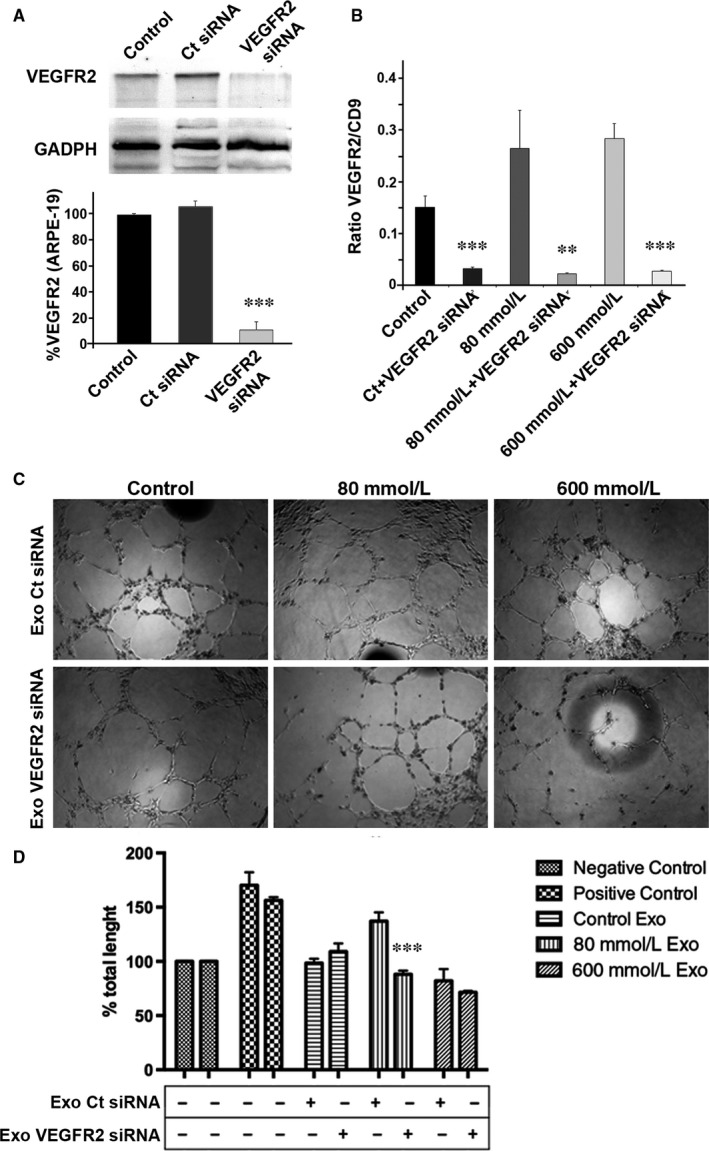
Angiogenesis depends on VEGFR2 from RPE‐released exosomes. A, Blots show expression of VEGFR2 before and after VEGFR2 siRNA was applied to ARPE‐19 cells. The bar chart represents the relative levels of VEGFR2 expression when compared to control. B, When VEGFR2 siRNA was applied in ARPE‐19 cultures, the set of exosomes expressing VEGFR2 was reduced significantly in every situation. C, HUVEC treated with exosomes from RPE cells treated differently form tubes. D, Total length after applying exosomes into HUVEC cultures. When exosomes from low‐stressed RPE cells treated with VEGFR2 siRNA were added to HUVEC cultures, total tube length was significantly reduced. Flow cytometry dot plots available in Figure S4. Values are expressed as mean ± SEM (N ≥ 3). Significance levels: P < .01 (**) and P < .001 (***)