
Figure 1.
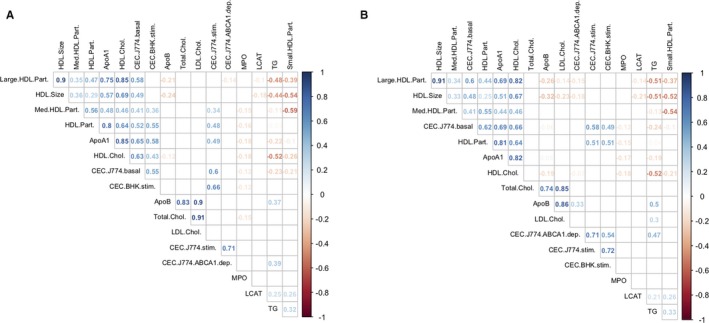
Matrix of pairwise Spearman's correlation coefficients calculated for high‐density lipoprotein (HDL) and other blood lipid–related phenotypes measured in (A) 996 coronary artery disease–free participants and (B) 1000 patients with myocardial infarction (MI) from the Montreal Heart Institute Biobank. For each pairwise comparison, we added to the plot the corresponding Spearman's correlation coefficient (ρ) if the correlation test P<0.05. We applied unsupervised hierarchical clustering using Wald's method to graphically represent the results. Apo indicates apolipoprotein; BHK, baby hamster kidney; CEC, cholesterol efflux capacity; Chol., cholesterol; dep., dependent; LCAT, lecithin/cholesterol acyltransferase; LDL, low‐density lipoprotein; Med., medium; MPO, myeloperoxidase; Part., particle; stim., stimulated; TG, triglycerides.