
Figure 3.
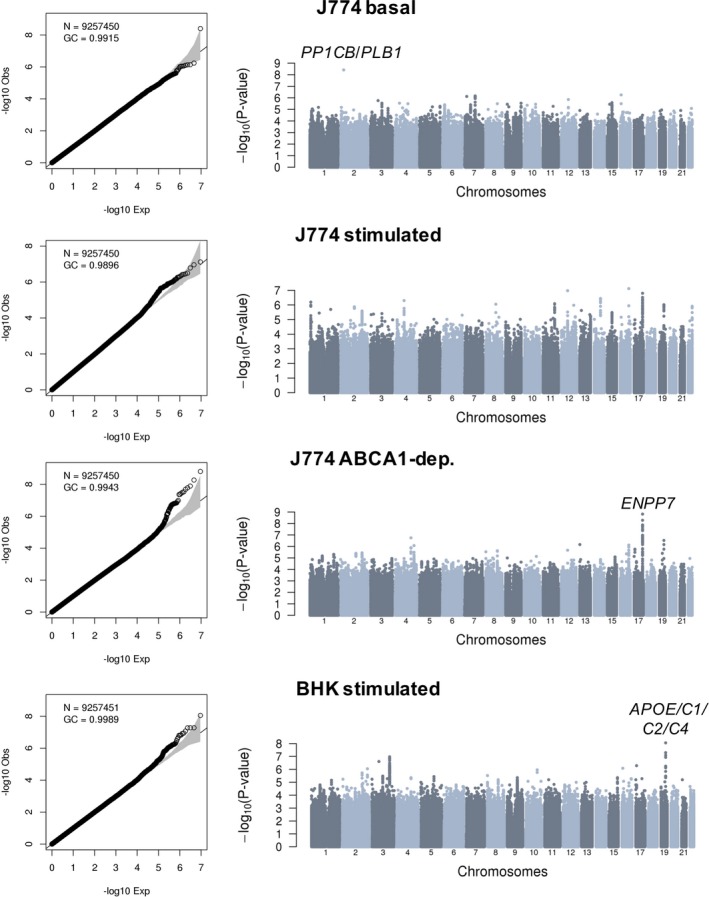
Genome‐wide association results for 4 different cholesterol efflux capacity measures in 5293 participants from the Montreal Heart Institute Biobank. Quantile‐quantile and Manhattan plots are in the left and right columns of the figure, respectively. Association tests are corrected for sex, age squared, coronary artery disease status, experimental batches, statin treatment, high‐density lipoprotein cholesterol and triglyceride levels, and the first 10 principal components. For each association signal that reaches genome‐wide significance (P<6.25×10⁻⁹), we highlighted the closest relevant gene(s). BHK indicates baby hamster kidney; dep., dependent; GC, genomic control inflation factor; N, number of variants with minor allele frequency ≥1% tested.