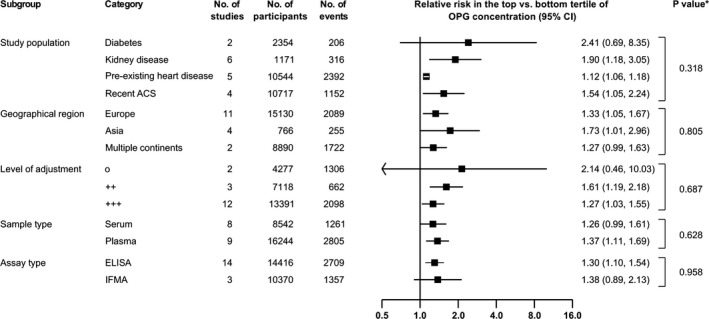
Figure 6.

Relative risks for cardiovascular outcomes in individuals in the top vs bottom tertile of osteoprotegerin (OPG) concentration, according to categories of study‐level characteristics. *P values were calculated from meta‐regression. Levels of adjustment: o, unadjusted; ++, adjusted for age, sex, and non–blood‐based risk factors; +++, additionally adjusted for at least 1 blood‐based risk factor. ACS indicates acute coronary syndrome; CI, confidence interval; IFMA, immunofluorometric assay.
