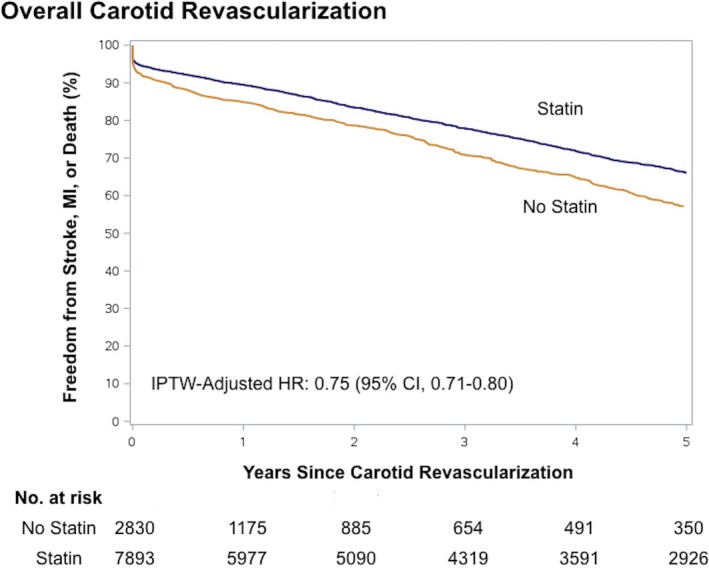
Figure 2.

Adjusted Kaplan–Meier curves of 5‐year outcomes after carotid revascularization by statin therapy. Shown are the 5‐year adjusted Kaplan–Meier curves for freedom from any stroke, myocardial infarction, or death after carotid revascularization. CI indicates confidence interval; HR hazard ratio; IPTW, inverse probability of treatment weighting; MI, myocardial infarction.
