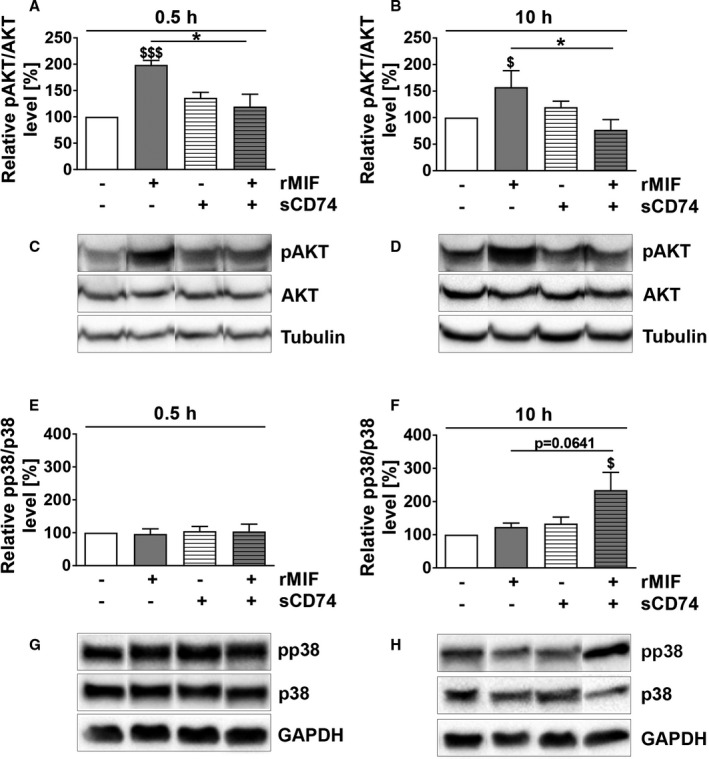
Figure 4.

sCD74 changes the kinase activation profile of MIF. Following stimulation of WT myofibroblasts, lysates were taken after 0.5 and 10 hours. Phosphorylation and total protein levels were assessed by Western blotting, band intensities were densitometric analyzed, and relative activation levels were normalized to control. Phosphorylation levels of AKT at (A and C) 0.5 and (B and D) 10 hours as well as the mitogen‐activated protein kinase p38 at (E and G) 0.5 and (F and H) 10 hours were determined. Densitometric analysis of immunostainings as well as representative blots are shown. Instead of showing the whole blot, relevant bands were cut out and arranged in the respective order. Uncut blots are shown in Figures S9 through 12. Data represent mean±SEM of at least 4 independent experiments. Data were analyzed with a 2‐tailed, unpaired t test. $ P<0.05, $$$ P<0.001 vs control, respectively; *P<0.05 vs rMIF. AKT indicates protein kinase B; MIF, macrophage migration inhibitory factor; pAKT, phosphorylated AKT; pp38, phosphorylated p38; rMIF, recombinant MIF; sCD74, soluble CD74; WT, wild type.
