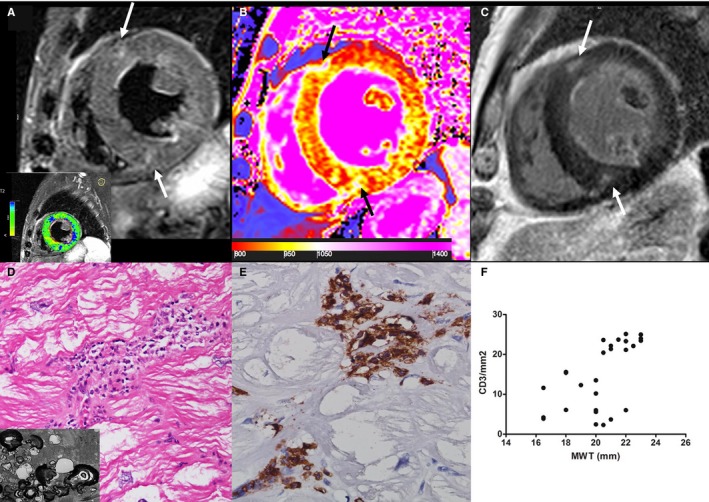
Figure 4.

Group 3 patient. A 65‐year‐old man with Fabry disease cardiomyopathy and moderate cardiac hypertrophy (maximal wall thickness [MWT]: 19 mm). On a T2‐weighted short τ inversion recovery image (A), some mesocardial foci (arrows) of myocardial edema are detectable at anterior and inferior interventricular junctions, matching enhanced areas (arrows) on a late gadolinium–enhanced image (C); analysis of T2‐weighted myocardium‐over‐skeletal muscle signal intensity ratio reveals myocardial edema in the inferolateral wall (blue myocardium in the lower box is T2 ratio ≥2.0). B, A diffuse marked decrease of T1 value (septum: 834±57 ms) is represented by a predominant red color in myocardium with areas of increase signal (1093–1170 ms) of fibrous replacement at interventricular insertions (black arrows). D, At histology (hematoxylin and eosin, ×200), severely hypertrophied and vacuolated cardiomyocytes are surrounded by CD3+ inflammatory cells (D and E). Insert in D shows vacuoles consisting of glycolipid bodies. F, Correlation between MWT and CD3 count (P<0.001, ρ=0.62) in all group 3 patients (n=30).
