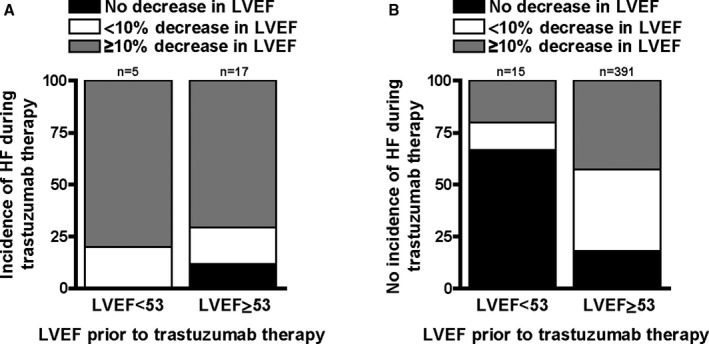
Figure 3.

Bar graphs illustrating the distribution of LVEF changes with trastuzumab therapy in patients diagnosed with HF (A) and patients without HF (B), stratified by baseline cardiac function (P=NS for panel A and P=0.0002 for panel B for group comparisons). LVEF indicates left ventricular ejection fraction.
