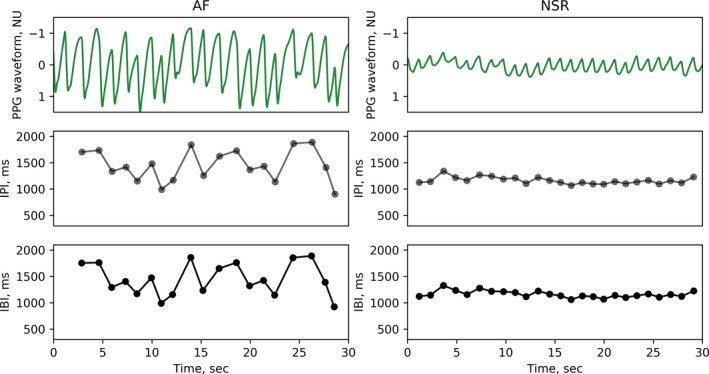
Figure 2.

Representative example of photo‐plethysmography (PPG) waveform, PPG‐derived inter‐pulse intervals (IPI), and corresponding ECG‐derived inter‐beat intervals (IBI) during atrial fibrillation (AF; left) and normal sinus rhythm (NSR; right) in the Holter data set (HOL).
