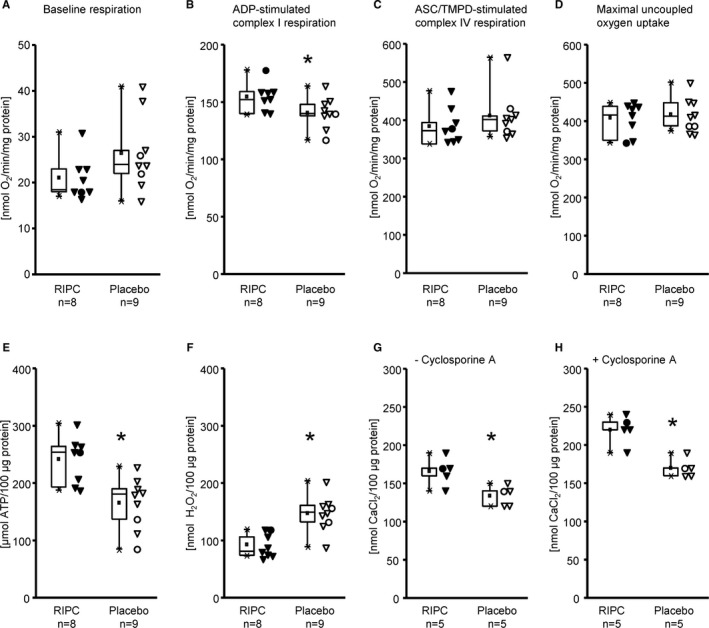
Figure 3.

Mitochondrial function of isolated mitochondria from right atrial appendages of patients with remote ischemic preconditioning (RIPC; black symbols) and with placebo (white symbols); triangles for males and circles for females. Baseline respiration (A), ADP‐stimulated complex I respiration (B), ASC/TMPD‐stimulated complex IV respiration (C), maximal uncoupled oxygen uptake with FCCP (D), ATP production (E), reactive oxygen species production (F), and calcium retention capacity, without (G) and with cyclosporine A (H). Data are presented as box plot showing minimum and maximum (crosses), interquartile range from 25% to 75% (box), mean (square), and median (line) and as individual data points, respectively; differences between RIPC and placebo were analyzed by unpaired Student t test. *P<0.05, RIPC vs placebo.
