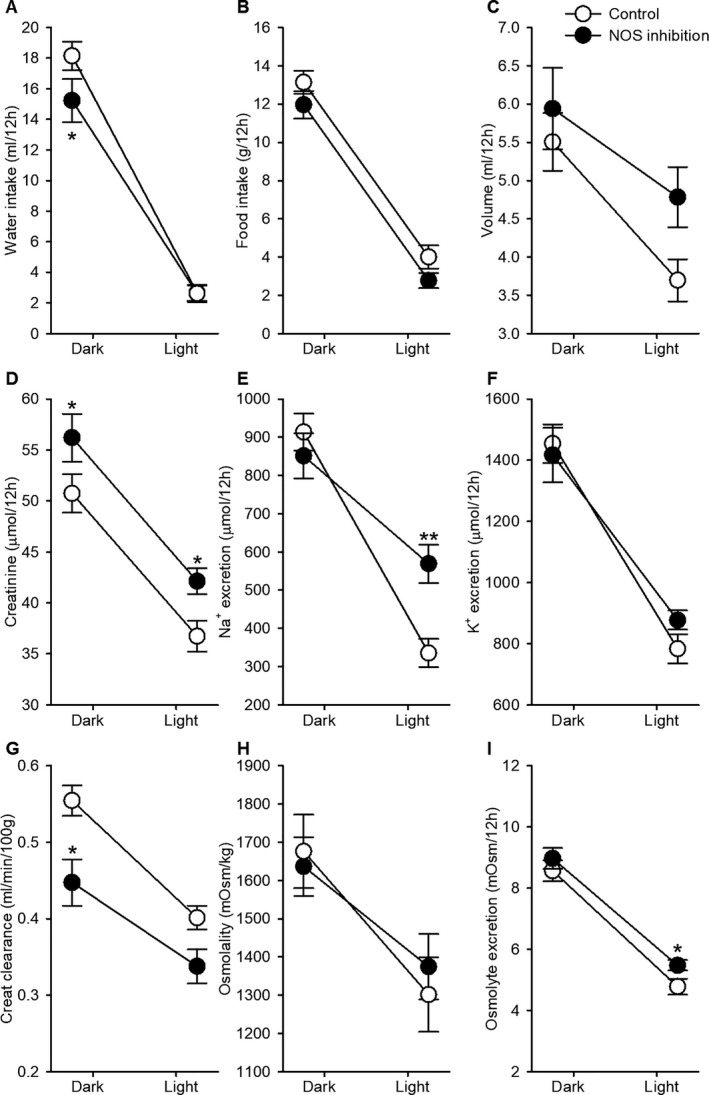
Figure 2.

Dark‐ and light‐phase analysis of urine and water/food intake. Rats were individually housed in metabolic cages for 24 hours. Urine was collected during the dark‐phase (active) and during the lights‐phase (resting) period. Data are expressed as mean±SEM for (A) water intake, (B) food intake, (C) urine volume, (D) creatinine excretion, (E) Na+ excretion, (F) K+ excretion, (G) creatinine clearance, (H) urine osmolality, and (I) osmolyte excretion. *P<0.05; **P<0.001 vs control, ANOVA for repeated‐measures post hoc Tukey test. NOS indicates nitric oxide synthase.
