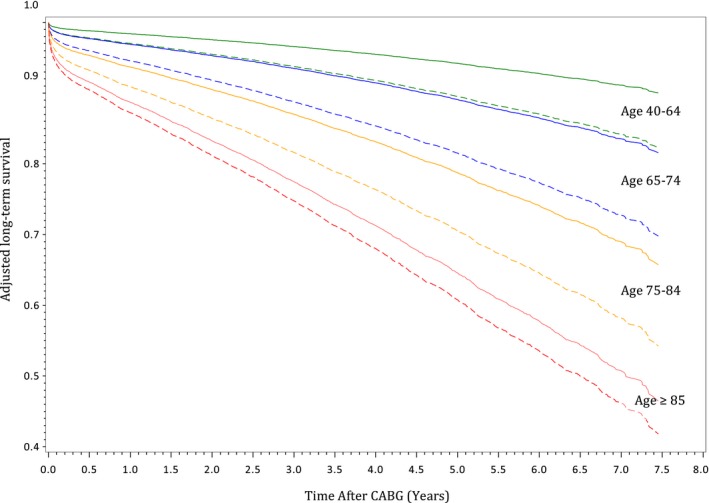
Figure 3.

Adjusted estimated long‐term survival of frail and nonfrail patients, stratified by age group. Curves were adjusted for sex, socioeconomic status, and case urgency status. The solid lines represent estimated survival in nonfrail patients. The dotted lines represent estimated survival in frail patients. CABG indicates coronary artery bypass grafting.
