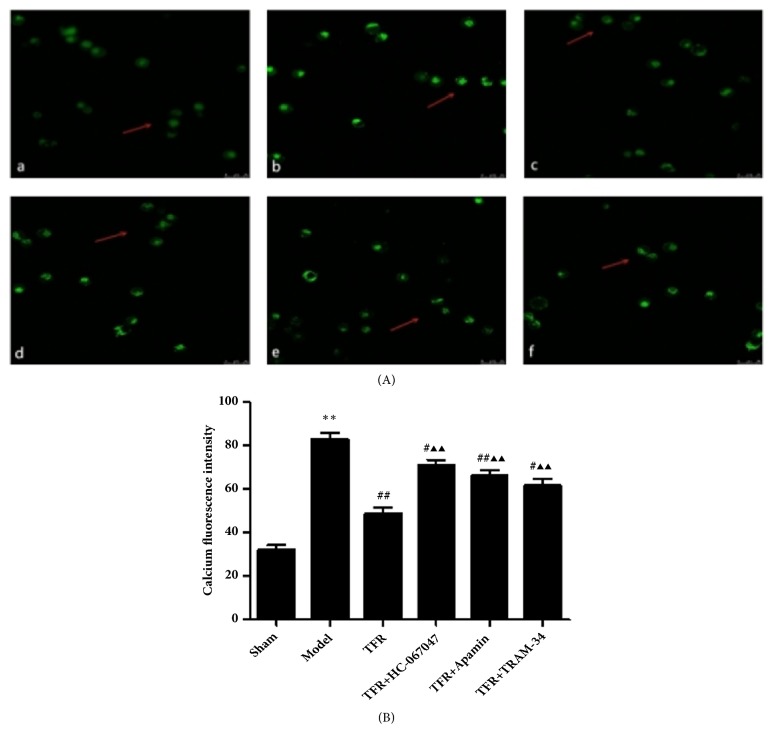
Figure 7.
Laser scanning confocal analysis of Ca 2+ fluorescence intensity in rat cerebral basilar artery smooth muscle cells. In each group the drugs/chemicals were injected via tail vein 30 min before ischemia, and all rats were killed after ischemia for 25 min followed by 2 h of reperfusion. (A) Cells pretreated with Fluo-3/AM. (a) Ca2+ fluorescence intensity in Sham group; (b) Ca2+ fluorescence intensity in Ischemic group; (c) Ca2+ fluorescence intensity in TFR group; (d) Ca2+ fluorescence intensity in TFR+HC-067047 group; (e) Ca2+ fluorescence intensity in TFR+Apamin group; (f) Ca2+ fluorescence intensity in TFR+TRAM-34 group. (B) Effect of TFR and each channel blocker on Ca2+ fluorescence intensity of cerebral basilar artery smooth muscle cells in rats of ischemia/reperfusion injury. ∗P <0.01 versus Sham; #P<0.05, ##P<0.01 versus Model (Ischemic); ▲▲P<0.01 versus TFR.

