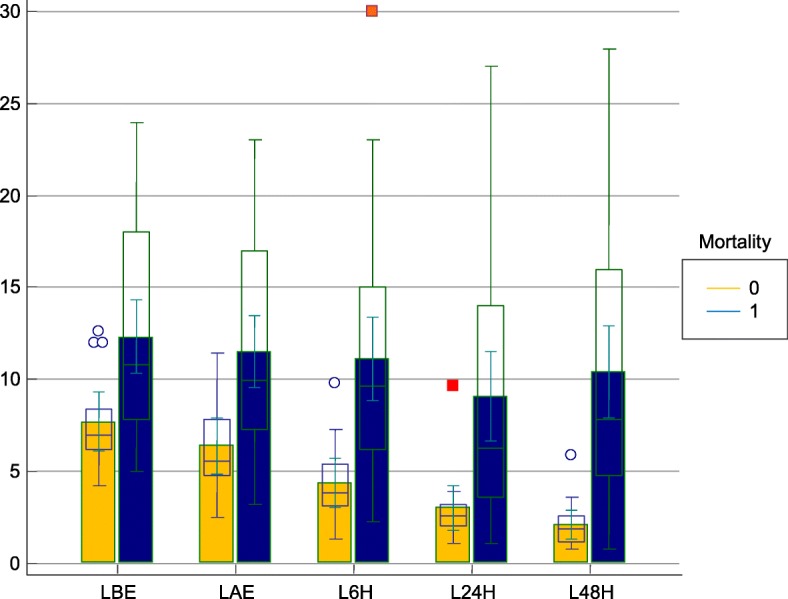
Fig. 2.

Changes in blood lactate levels detected on different time points depending on mortality. Mortality 1, represents the nonthe survivor group while mortality 0 represents the survivor group. LBE, Lactate level pre-ECMO (mmol/l); LAE, Lactate level post-ECMO (mmol/l); L6 h, Lactate level 6 h after ECMO implantation; L24 h, Lactate level 24 h after ECMO implantation; L48 h, Lactate level 48 h after ECMO implantation
