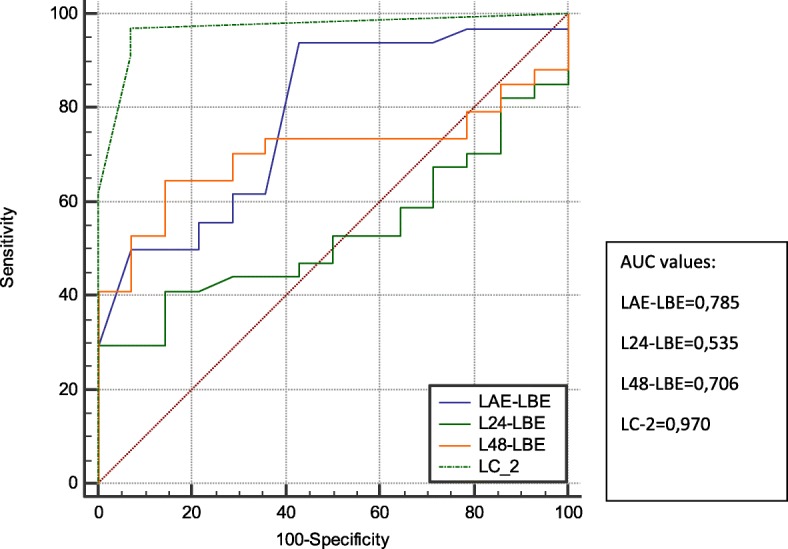
Fig. 3.

ROC curves to demonstrate the power of predictively of LC-1 at each time point and LC-2 on 30-day mortality. ROC, receiver operating characteristics; AUC, area under the (ROC) curve; LBE, Lactate level pre-ECMO (mmol/l); LAE, Lactate level post-ECMO (mmol/l); L24 h, Lactate level 24 h after ECMO implantation; L48 h, Lactate level 48 h after ECMO implantation; LC-2, duration between ECMO implantation time and time point that Lactate cleared more than 10% of the initial level
