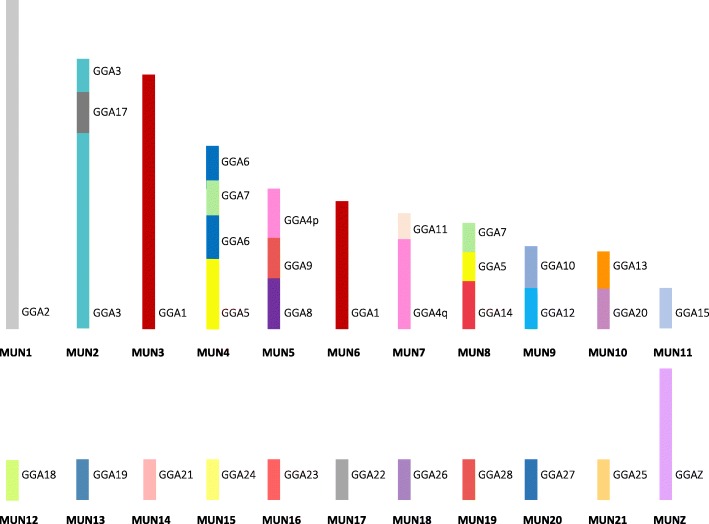
Fig. 4.
Ideogram representation of the gross genomic structure of the budgerigar (Melopsittacus undulatus—MUN) with chicken homologies per chromosome. Each GGA (chicken) homolog is represented as a different color as assigned in Fig. 3. Intrachromosomal differences are not shown here but listed Additional file 1: Table S2

