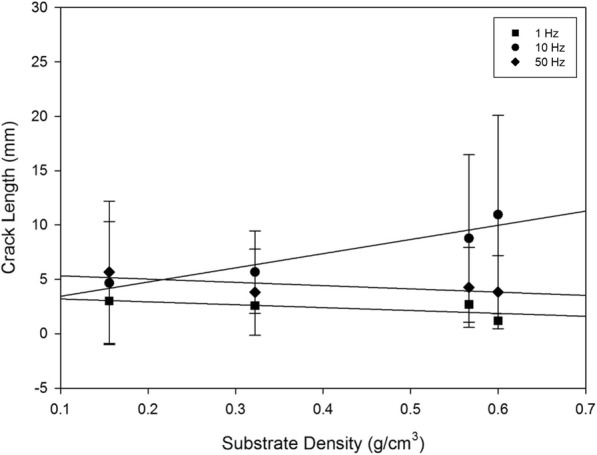
Fig. 6.

Mean crack length plotted with substrate density at 1, 10 and 50 Hz for off-bone articular cartilage, represented by the square, circle and diamond, respectively. Linear regression displayed by eq. (1) fit the data at R2 values of 0.485, 0.909 and 0.524 at 1, 10 and 50 Hz, respectively. Error bars represent standard deviations
