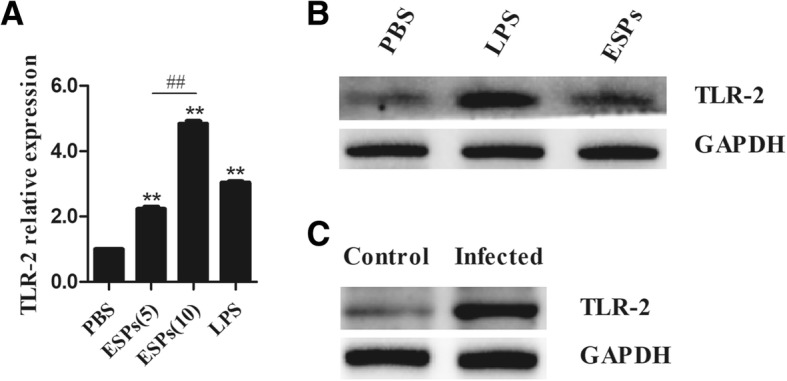
Fig. 2.

The expression of TLR-2 in B cells stimulated by EgPSC-ESPs or in B cells isolated from infected mice. a The mRNA levels of TLR-2 in B cells stimulated by PBS, EgPSC-ESPs (5, 10 μg/ml), or LPS (10 μg/ml). b The protein levels of TLR-2 in B cells post stimuli mentioned. c The expression of TLR-2 in B cells isolated from the spleen of control and PSC infected mice. The data represent the means ± SD of triplicate wells in one round experiment (n = 6), and the results were repeated in three independent experiments. Differences were analyzed by one-way ANOVA and Bonferonni correction. VS PBS group, *P < 0.05; **P < 0.001. ESPs(5) VS ESP(10), #P < 0.05; ##P < 0.001
