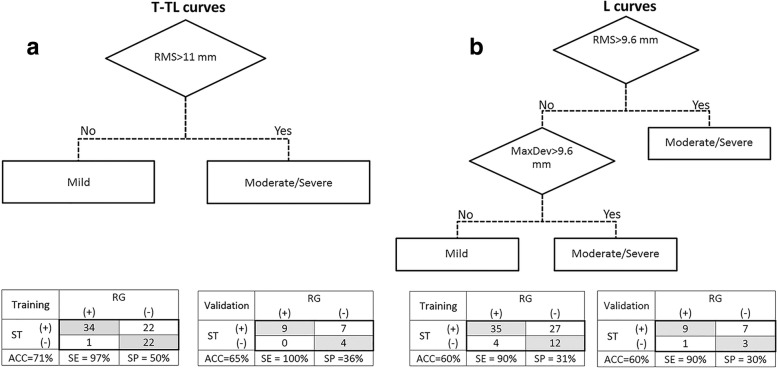
Fig. 3.
The classification trees and the tabulated accuracy (ACC), sensitivity (SE), and specificity (SP) values for the curve severity classification of (a) T-TL curves and (b) L curves. The (+) and (−) illustrate the moderate/severe and mild groups, respectively. RG: radiograph, ST: surface topography

