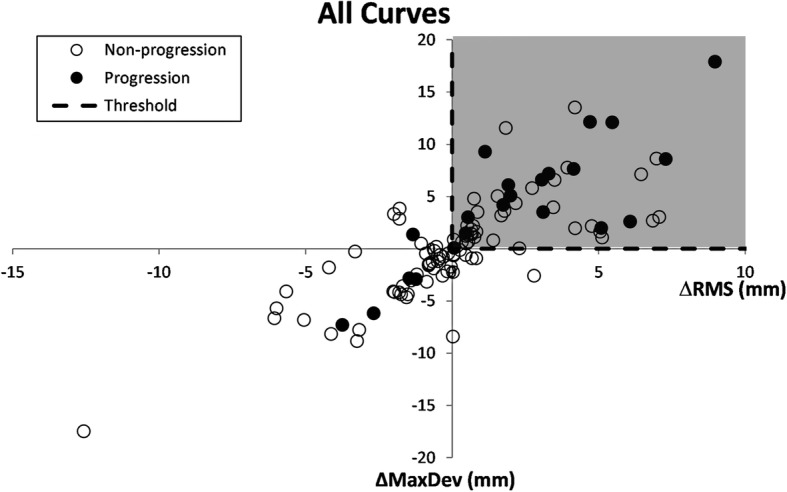
Fig. 7.

The distribution of ΔRMS and ΔMaxDev parameters. The threshold of ΔRMS and ΔMaxDev are shown with the dashed lines. The shaded area shows the region that is considered as the Progression group. The close and open circles represent a progressed (ΔCA ≥ 5°) and Non-progressed (ΔCA < 5°) case based on the radiograph measurements, respectively
