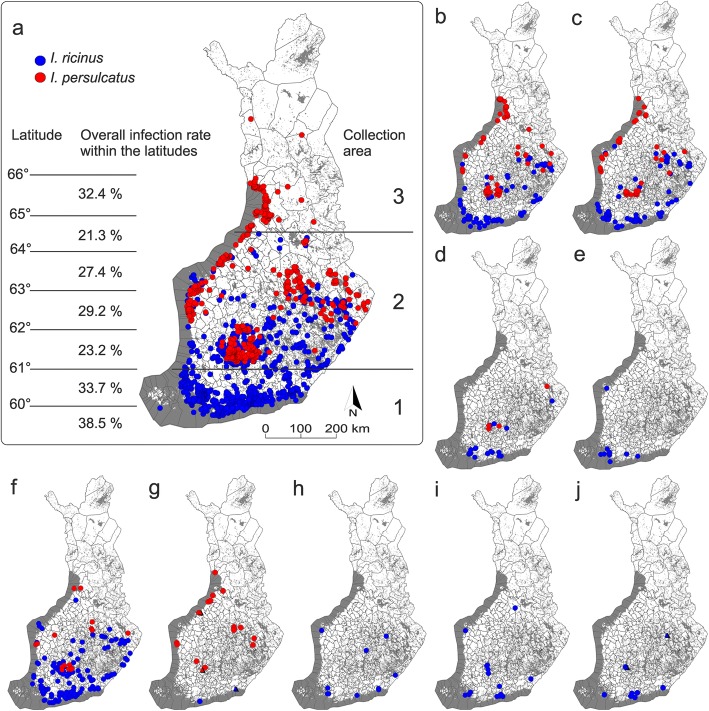
Fig. 1.
Geographical distribution of the analysed samples with collection information (coordinates) provided by citizens (n = 3418). Blue dots indicate collection points of I. ricinus samples and red dots I. persulcatus. a Map showing the geographical distribution of all samples analysed: I. ricinus (n = 1997) and I. persulcatus (n = 1421). Overall infection rates within the latitudes are shown in the left. 1: I. ricinus-dominated area; 2: sympatric area; and 3: I. persulcatus-dominated area are lined in the right. The following maps show the geographical distribution of the observed pathogens in the tick samples: b Borrelia garinii (n = 200); c B. afzelii (n = 149); d B. valaisiana (n = 25); e B. burgdorferi (s.s.) (n = 13); f Rickettsia helvetica (n = 231); g “Candidatus Rickettsia tarasevichiae” (n = 20) and R. monacensis (n = 3) as triangles; h Anaplasma phagocytophilum (n = 12); i “Candidatus Neoehrlichia mikurensis” (n = 17); j Babesia venatorum (n = 7) and B. divergens (n = 2) as triangles

