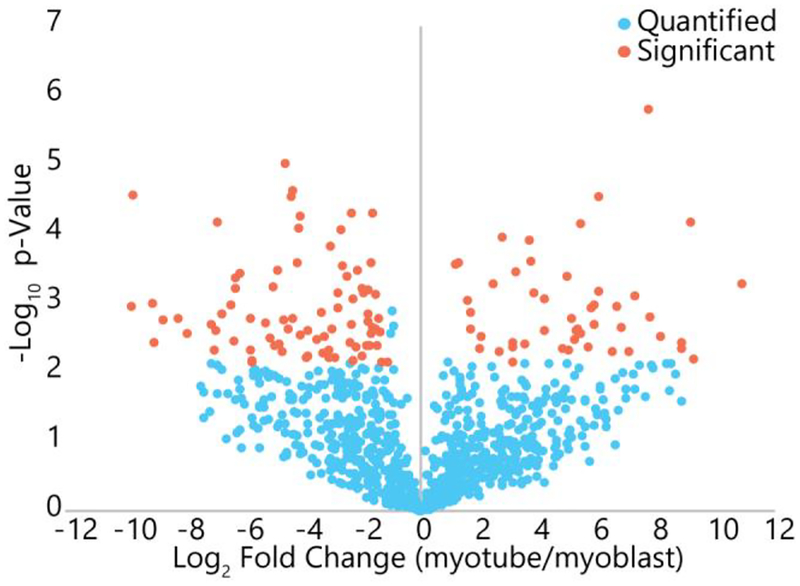
Figure 5.
Volcano plot of changes in quantified proteoforms between myoblasts and myotubes. Blue represents proteoforms that did not change significantly, while orange represents those that did change significantly (fold change greater than 2 and p-value satisfying a Benjamini-Hochberg adjusted 5% FDR threshold). Of the quantified proteoforms, 13.7% showed significant changes between the two cell types.

