Figure 6.
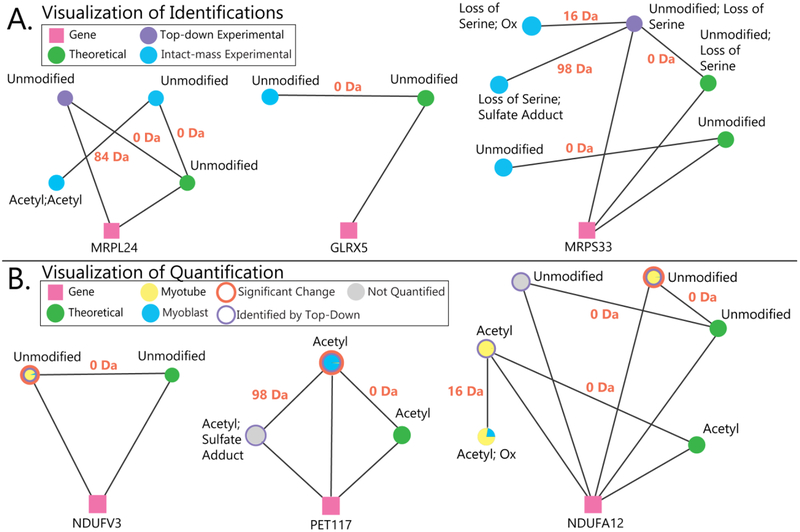
A) Examples of visualized proteoform families. Pink squares represent genes, and green circles represent theoretical proteoforms. Experimental proteoforms identified by top-down fragmentation are purple circles, and experimental proteoforms observed in MS1 spectra but not identified by top-down analysis are blue circles. The lines between circles are labeled with mass differences corresponding to modifications between proteoforms. In the left family, top-down analysis identified the unmodified form of MRPL24, and Proteoform Suite enabled the identification of the acetylated proteoform by intact-mass analysis. In the middle family, the mitochondrial proteoform family GLRX5 was identified by intact-mass alone; this protein would have remained unidentified if only a typical top-down analysis had been performed. The right family shows how Proteoform Suite identified three additional proteoforms by intact-mass analysis. B) Examples of quantified proteoform families. For quantified experimental proteoforms, a pie chart of yellow and blue depicts the abundance ratio in myoblasts and myotubes, an orange annulus indicates a significant change, and a purple annulus indicates that the experimental proteoform was identified through top-down fragmentation; unquantified experimental proteoforms are illustrated as grey circles. In the left family, an unmodified proteoform from the mitochondrial gene NDUFV3 was more abundant in myotubes, and in the middle family, an acetylated form of PET117 was more abundant in myoblasts. In the right family, different oxidized and acetylated proteoforms were identified from the NDUFA12 gene; an unmodified form was significantly more abundant in myotubes.

