
Figure 7.
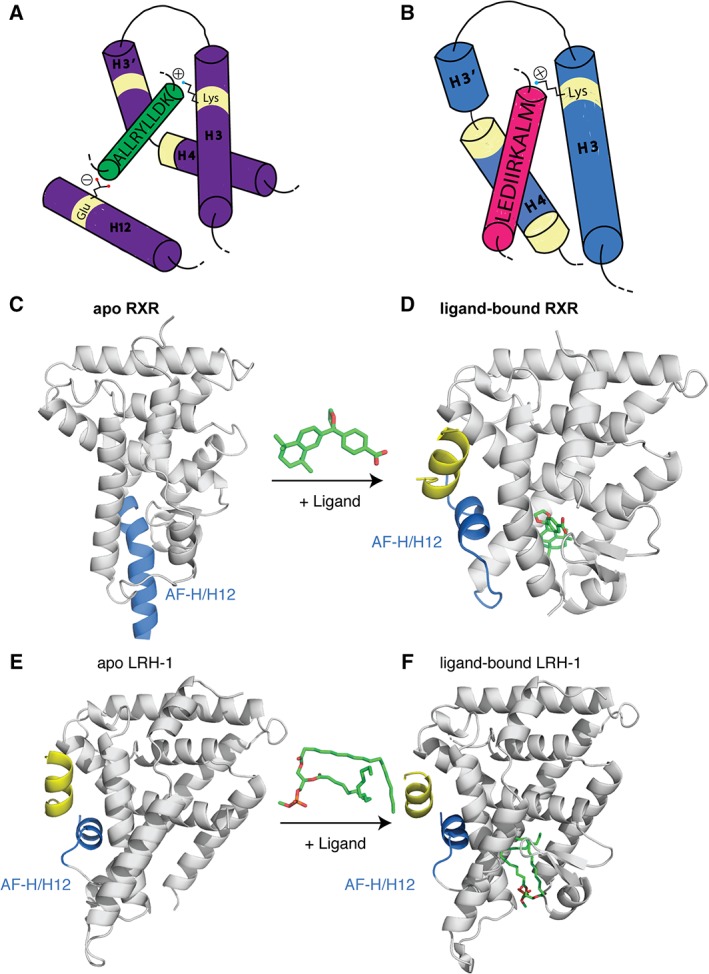
NR co‐regulator interactions. (A) Cartoon representation of the co‐regulator LXXLL peptide (green) interacting with the AF surface (purple). The peptide is held in place by a conserved charge clamp interaction formed by a glutamate on H12 and a lysine on H3. (B) Cartoon representation of co‐repressor peptides (pink) interacting with the AF surface (blue). Co‐repressors contain extended (L/I)XX(I/V)I or LXXX(I/L)XXX(I/L) motifs that do not allow for the charge clamp formation. The basis of the “mouse‐trap” model was made by comparing the apo (C) and ligand bound (D) structures of RXR. Upon ligand binding a large rearrangement of H12 is seen (PDBs: http://firstglance.jmol.org/fg.htm?mol=1LBD, http://firstglance.jmol.org/fg.htm?mol=1MVC). (E,F) The more favored “dynamic stabilization” model of NR activation suggests H12 does not undergo such a large conformational change, but instead H12 flexible and ligand binding simply stabilizes the helix. This model was proposed after other apo NR structures, did not show H12 displaced and, upon ligand binding, there was little change in the location of this helix (PDBs: http://firstglance.jmol.org/fg.htm?mol=4DOR, http://firstglance.jmol.org/fg.htm?mol=4PLE). Co‐regulator peptides are colored blue and ligands are shown as sticks (green).