Figure 6.

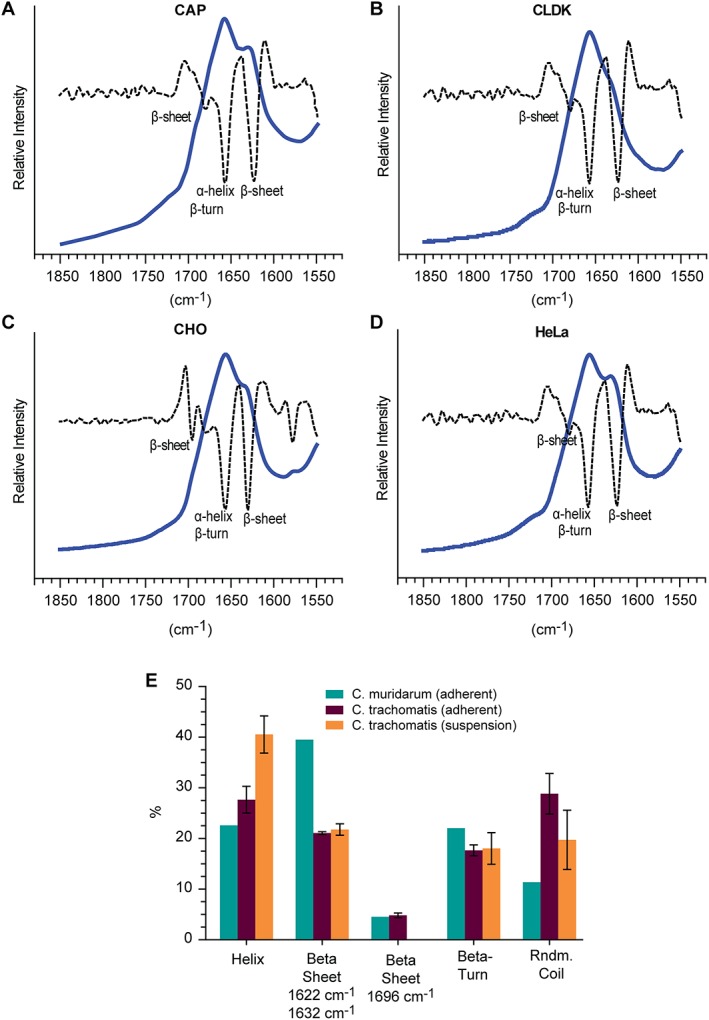
ATR FTIR of Chlamydia trachomatis Serovar E nMOMP expressed in various suspension cell lines. FTIR spectra (solid line) and second derivative (dotted line) of native MOMP. (A) CAP, (B) CLDK, (C) CHO, and (D) HeLa. (E) Average secondary structure composition of nMOMP calculated by spectral deconvolution and non‐linear least square regression analysis.
