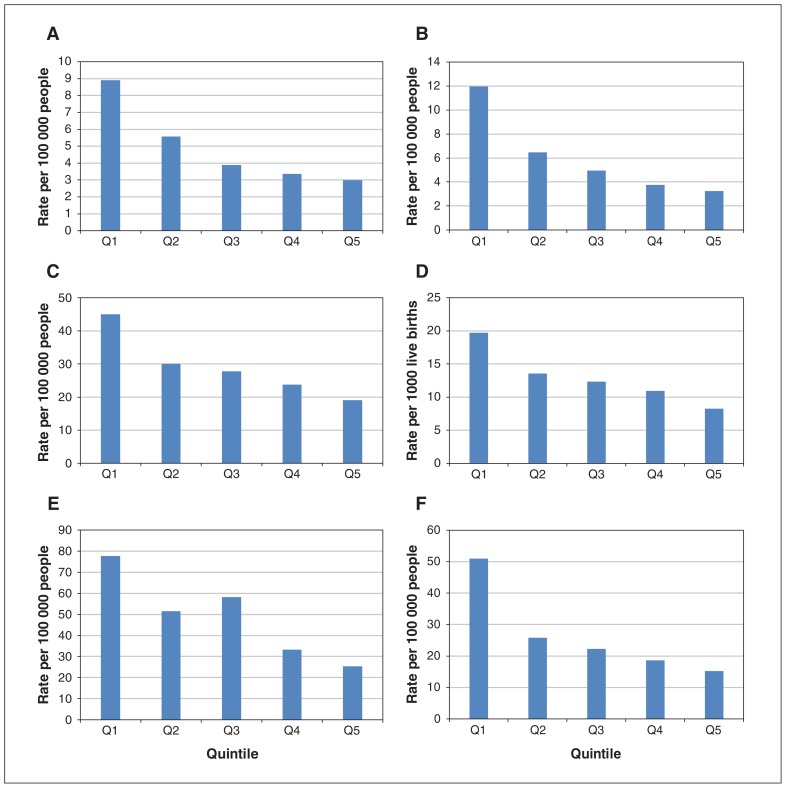
Figure 2:
Crude rates of emergency department visits (A) and hospital admission (B) for opioid poisoning, nonpoisoning opioid-related emergency department visits (E) and hospital admission (F), and neonatal abstinence syndrome (D) by neighbourhood income quintile in Ontario in 2016, and of opioid-related death by neighbourhood income quintile in Ontario in 2015 (C). Note: Q1 = lowest-income neighbourhood, Q5 = highest-income neighbourhood.

