
Figure 2.
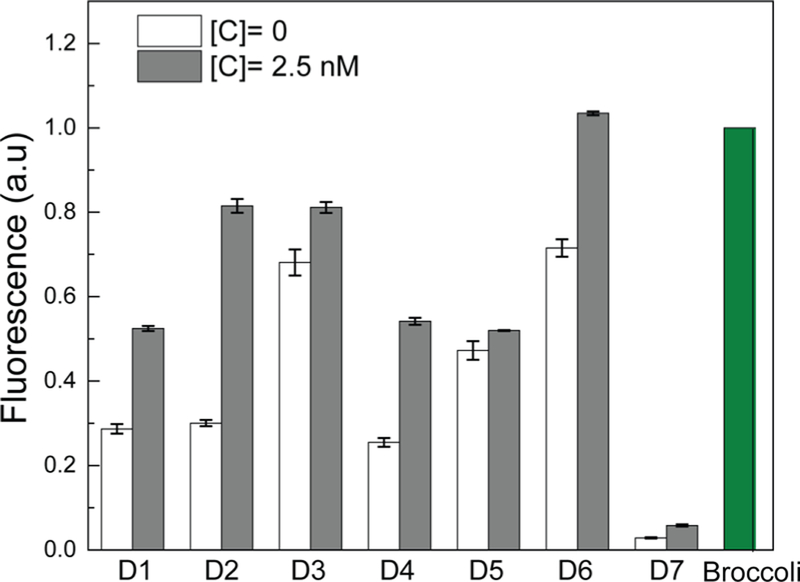
Optimizing the signal-to-background ratio of CHARGE based on different sequence designs. Shown are normalized fluorescence values of three independent replicates as measured in a solution containing 0 or 2.5 nM target (C), 250 nM H1 and H2 (or Broccoli itself), and 5 μM DFHBI-1T. All the RNA sequences were PAGE gel-purified, and the fluorescence values were normalized to the Broccoli intensity.