
Figure 4.
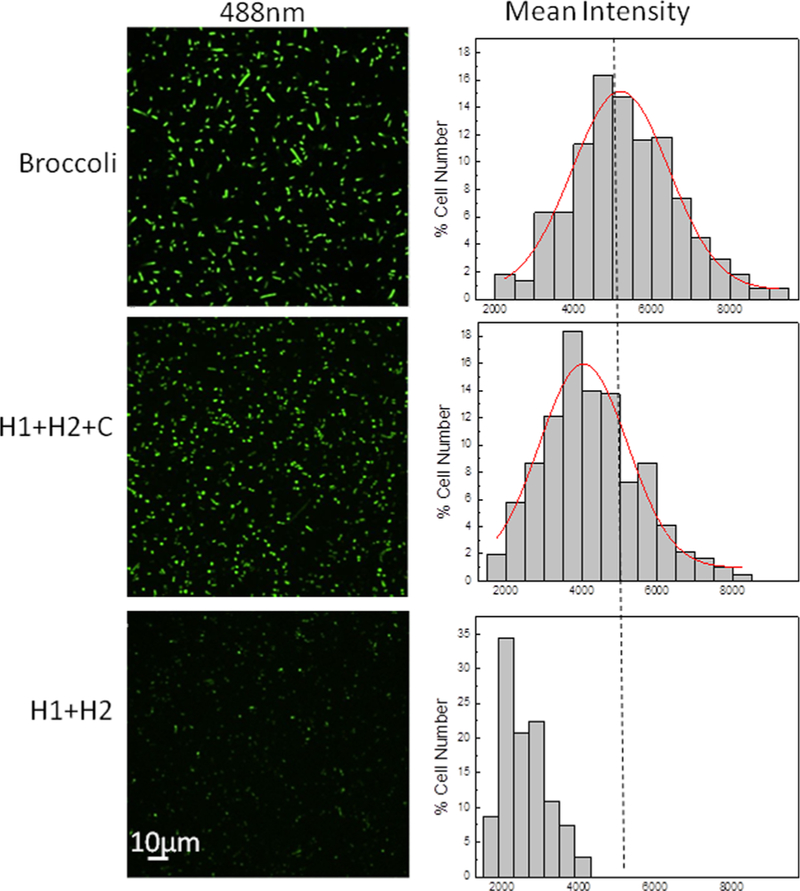
Confocal fluorescence imaging with live BL21 (DE3)* cells. After 2 h IPTG induction, 200 μM DFHBI-1T was added for 30 min before imaging of cells coexpressing pETDuet-H1/H2 and pCDFDuet- target (H1+H2+C), or expressing only pETDuet-H1/H2 (H1+H2), or expressing only pETDuet-Broccoli (Broccoli). Distribution of cellular fluorescence levels was shown on the right. Here, individual cells were binned according to their brightness. The percentage of cells in each bin was plotted. A total of 300 cells were measured in each case from three experimental replicates.