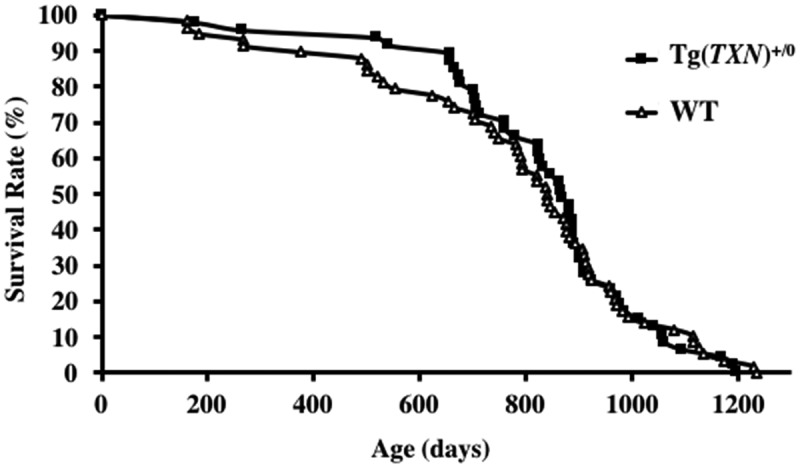
Figure 3.

The survival curves of Tg(TXN)+/0 and WT mice. The survival curves of Tg(TXN)+/0 (closed squares) and WT (open triangles) mice are presented. The cohort consists of 47 Tg(TXN)+/0 mice and 58 WT male mice. The survival curves did not show a significant difference between Tg(TXN)+/0 and WT mice (p > 0.05).
