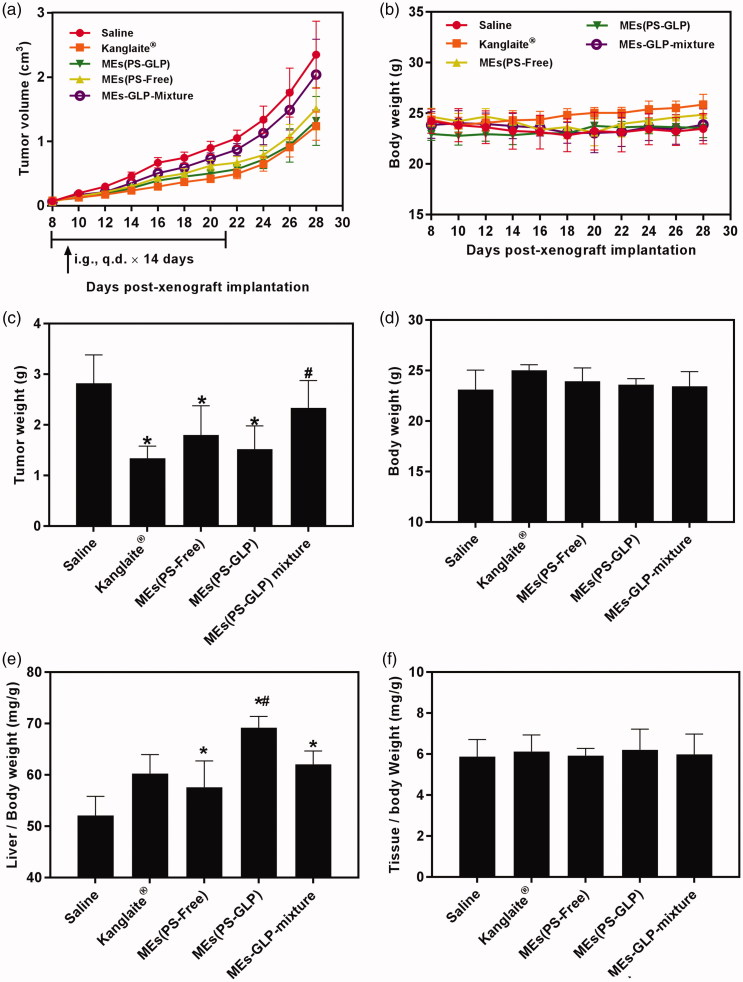
Figure 5.
Evaluation of antitumor efficiency in vivo. The curve of (a) tumor growth and (b) body weight change of A549 tumor-bearing mice after various treatments for three weeks. The (c) tumor weight and (d) body weight of A549 tumor-bearing mice after various treatments on Day 30. *p < 0.05, compared with saline group. #p < 0.05 compared with Kanglaite® injection group. The (e) liver index and (f) spleen index of A549 tumor-bearing mice after various treatments in Day 30. *p < 0.05, compared with saline group. #p < 0.05 compared with MEs-GLP mixture group. All the data are presented as mean ± SD (n = 8).

