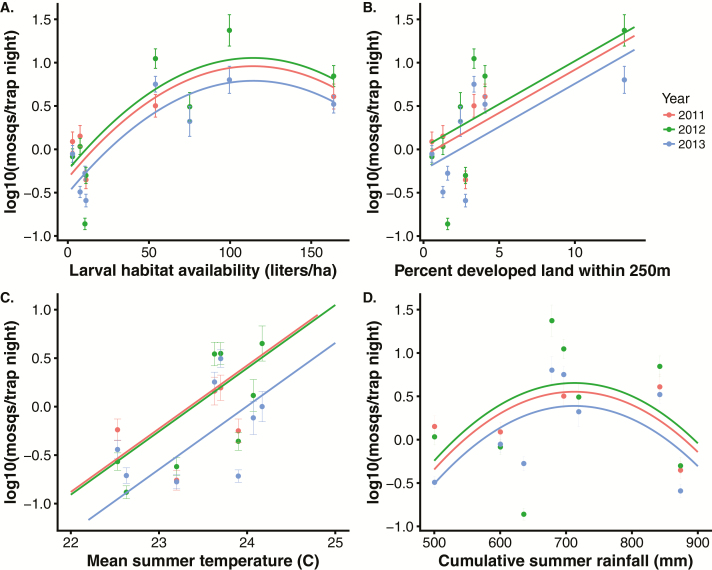
Fig. 2.
Aedes albopictus abundance, developed land, larval habitat availability, temperature and rainfall. All fitted lines include site as a random effect. (A) Mosquito abundance plotted against larval habitat availability (liters/ha). Points are site-level log-transformed Aedes albopictus abundance (± 1 SE) from 2011 to 2013. Fitted lines: Abundance = −0.78 + 0.5 (±SE = 0.004) * larval habitat availability (P = 1.22 × 10⁻⁵) − 2.3 × 10⁻⁴ (±SE = 7.4 × 10⁻⁵) * larval habitat availability2, P = 0.002; year 2012 coefficient compared to 2011 = 0.22 ± 0.16, P = 0.17; year 2013 coefficient compared to 2011 = −0.39 ± 0.16, P = 0.02; N trapping nights = 770). (B) Mosquito abundance plotted against percent developed land within 250 m of sites. Fitted lines: Abundance = −0.18 + 0.23 (±SE = 0.08) * percent developed land within 250 m, P = 0.004; year 2012 coefficient compared to 2011 = 0.23 ± 0.16, P = 0.15; year 2013 coefficient compared to 2011 = −0.37 ± 0.16, P = 0.02. Excluding the right-most points increases the land use slope to 0.59 and the regression remains significant (P = 0.03). (C) Mosquito abundance plotted against mean summer temperature (°C). Fitted lines: Abundance = −35.4 + 1.5 (±SE = 0.5) * mean summer temperature, P = 0.003; year 2012 coefficient compared to 2011 = 0.24 ± 0.17, P = 0.15; year 2013 coefficient compared to 2011 = −0.37 ± 0.17, P = 0.03. (D) Mosquito abundance plotted against cumulative summer rainfall (mm). Fitted lines: Abundance = −7.92 + 0.019 (±SE = 0.01) * summer rainfall (P = 0.07) − 4.6 × 10⁻⁵ (±SE = 2.6 × 10⁻⁵) * summer rainfall2; year 2012 coefficient compared to 2011 = 0.23 ± 0.16, P = 0.15; year 2013 coefficient compared to 2011 = −0.38 ± 0.16, P = 0.02.

