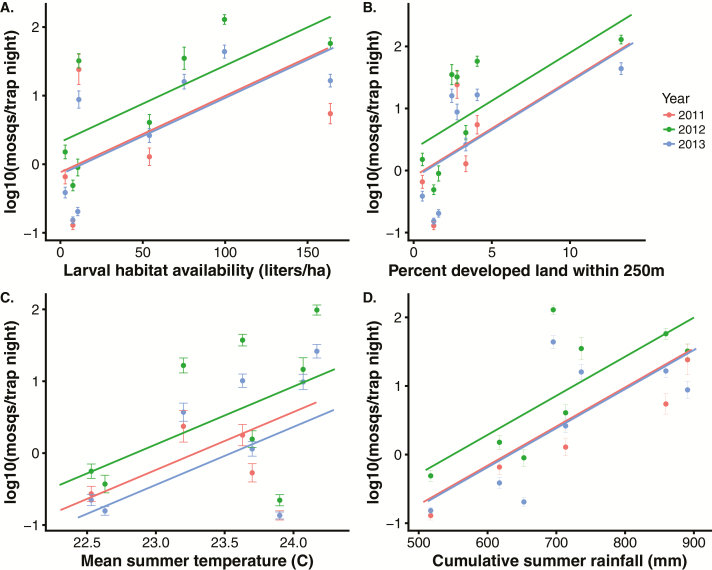
Fig. 3.
Cx. quinquefasciatus abundance, developed land, larval habitat availability, temperature and rainfall. All fitted lines include site as a random effect. (A) Mosquito abundance plotted against larval habitat availability (liters/ha). Points are site-level log-transformed means of Cx. quinquefasciatus abundance (± 1 SE) from 2011 to 2013. Fitted lines: Abundance = −0.31 + 0.026 (± SE = 0.009) * larval habitat availability, P = 0.008; year 2012 coefficient compared to 2011 = 1.06 ± 0.15, P < 0.001; year 2013 coefficient compared to 2011 = 0.014 ± 0.16, P = 0.92; N trapping nights = 770). (B) Mosquito abundance plotted against percent developed land within 250 m of sites. Fitted lines: Abundance = 0.36 + 0.14 (±SE = 0.14) * percent developed land within 250 m, P = 0.01; year 2012 coefficient compared to 2011 = 1.06 ± 0.15, P < 0.001; year 2013 coefficient compared to 2011 = 0.012 ± 0.15, P = 0.91. Excluding the right-most points increases the land use slope to 1.21 and the regression remains significant (P = 0.003). (C) Mosquito abundance plotted against mean summer temperature (°C). Fitted lines: Abundance = −43.45 + 1.85 (±SE = 0.8) * mean summer temperature, P = 0.02; year 2012 coefficient compared to 2011 = 1.1 ± 0.15, P < 0.001; year 2013 coefficient compared to 2011 = 0.02 ± 0.16, P = 0.91. (D) Mosquito abundance plotted against cumulative summer rainfall (mm). Fitted lines: Abundance = −8.29 + 0.013 (±SE = 0.004) * cumulative summer rainfall, P = 0.002; year 2012 coefficient compared to 2011 = 1.1 ± 0.15, P < 0.001; year 2013 coefficient compared to 2011 = 0.03 ± 0.16, P = 0.85.

