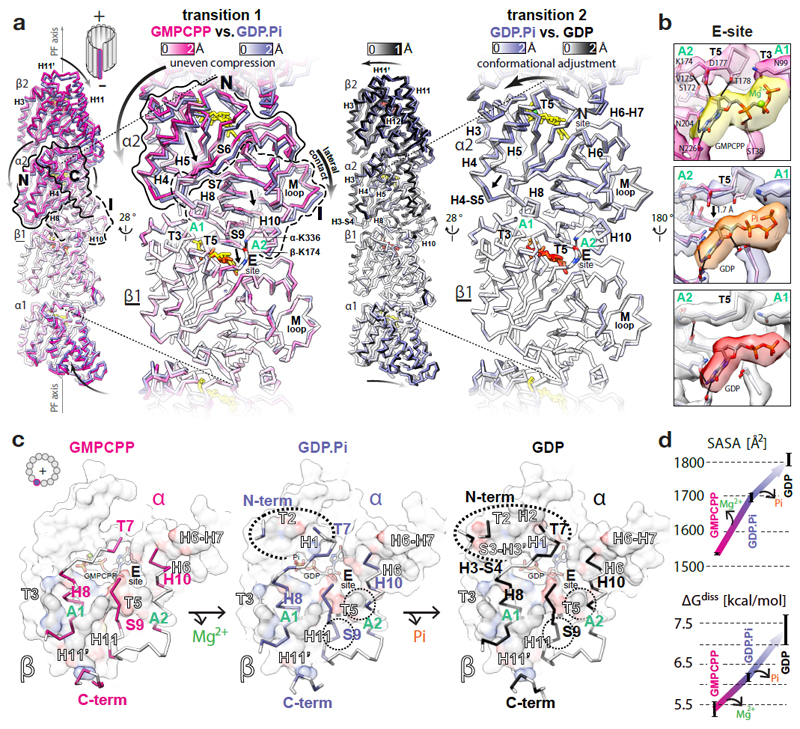
Figure 2. GTPase-dependent structural transitions strengthen the longitudinal MT lattice contacts.
a, Backbone front view and angled close-up cut-away view comparisons of different MT nucleotide states based on superposition on the β1-subunit (underlined); coloured by the degree of displacement, heteroatom or as follows: GMPCPP, red; GDP.Pi, orange; GDP, red; Mg2+, green. Tubulin domains are outlined and their overall relative movements around A1 and A2 anchor points are indicated with straight arrows. Curved arrows indicate how these transitions influence tubulin in the context of MT lattice. b, Conformational change of the T5 loop and the likely rearrangement of local hydrogen bonds (solid lines) shown with experimental densities and atomic models coloured as in a. c, +End view on the longitudinal inter-dimer interface; the relevant α-tubulin regions (colour-labelled) are shown as backbone traces superposed on top of the β-tubulin model-derived atomic surfaces of the whole β-subunits (white), with interfacing regions (black-and-white labels) coloured by element (C, grey; N, blue; O, red); nucleotides are shown as sticks; dotted ovals mark the interface expansion at each step. d, Plotted PDBePISA (www.ebi.ac.uk/pdbe/pisa/) calculations of the solvent-accessible surface areas (SASA) and the dissociation energies (ΔGdiss) of the longitudinal inter-dimer interfaces in different nucleotide states. The error bars represent 3 averaged inter-dimer interfaces generated with parallel refinements of non-crystallographic symmetry (NCS) mates in 6-dimer MT wall models (see Methods).

