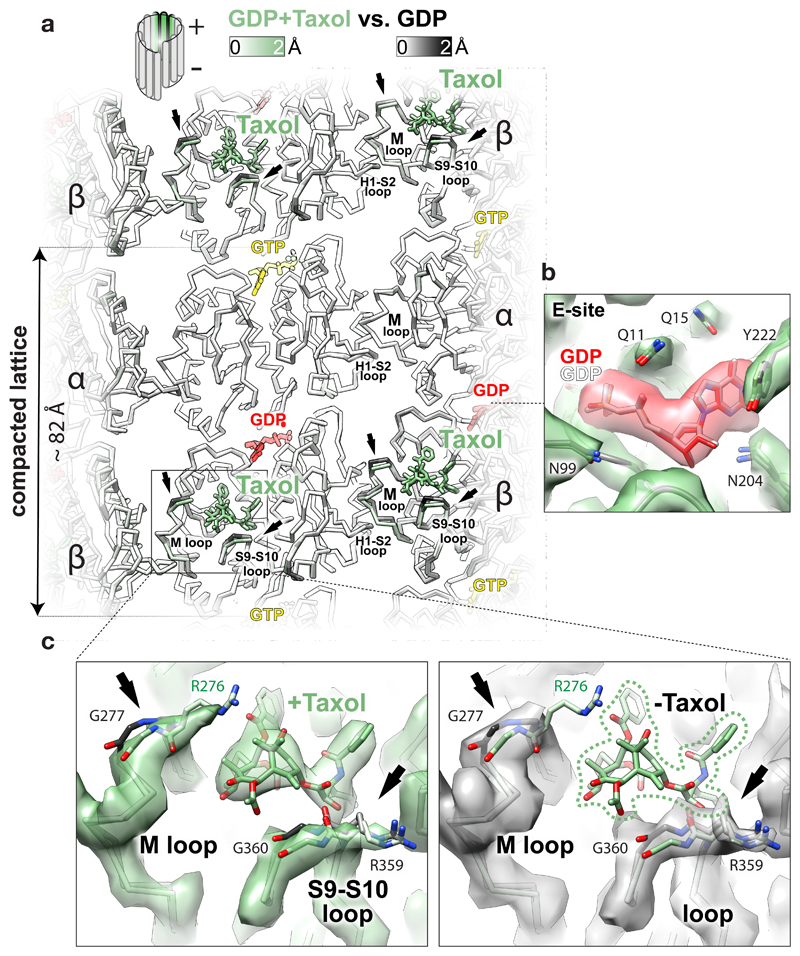
Figure 4. Effect of Taxol® binding to GDP-DCX-MT.
a, Lumenal backbone view of GDP-DCX-MT structure with Taxol® superposed on the GDP-DCX-MT structure without Taxol®, coloured by the degree of displacement or as follows: Taxol®, green sticks; GTP, yellow sticks; GDP, red sticks. Regions showing the largest displacement are limited to loops directly contacting the drug (arrows). b, Unchanged βE-site before (grey ribbon and the nucleotide) and after (green ribbon and red/heteroatom coloured nucleotide) addition of Taxol®, shown in the density of the MT lattice containing Taxol®; selected residues are shown as sticks coloured by heteroatom. c, Close-up on Taxol® binding site in GDP-DCX-MT reconstruction with Taxol® (green map) and without Taxol® (grey map), focusing on local structural changes. The models are coloured as in a; the most displaced regions are shown as sticks where density is present, and pointed with arrows. Reconstruction without Taxol® has weaker density for R276 side chain (not visible at this density threshold), suggesting that Taxol® somewhat orders this residue in the Taxol®-bound MT. Taxol®’s close interaction with the βM loop – a main contributor to MT lateral contacts - explains how the lateral contacts are locked to promote MT lattice stability upon Taxol® binding.

