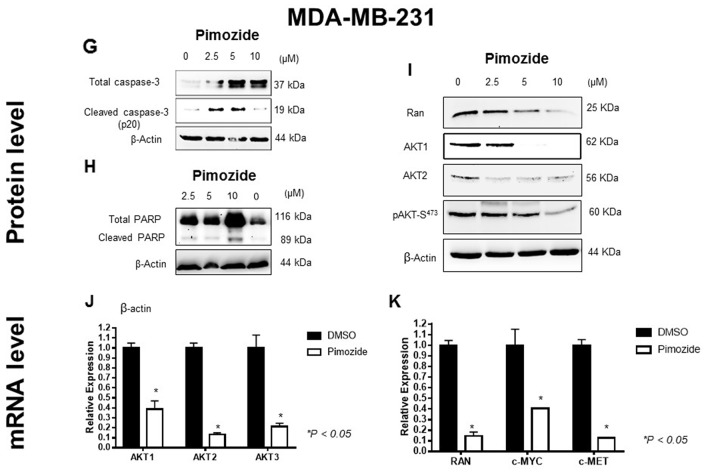
Figure 1. Pimozide inhibits cell proliferation in a dose- and time-dependent manner by inducing cell cycle arrest and DNA double strand breaks (DSBs).
(A) Phase contrast micrograph showing cell morphology of human breast cancer MDA-MB-231 and lung cancer A549 cells treated with Pimozide at different doses (μM) for 24 hours. Scale bar 100 μm. (B) Viability of MDA-MB-231 cancer cells, MCF10A normal breast cells, and A549 lung cancer cells after 48 hours treatment with Pimozide. (C) Cell cycle profiles. DNA content of fixed, propidium iodide-stained cells was analyzed by flow cytometry. MDA-MB-231 and A549 cells were incubated in the absence (control 0 μM of Pimozide with DMSO) or in the presence of Pimozide at different doses for 24 hours, and the percentage of cells in sub-G1 (M1) (hypodiploidy), G0/G1 (M2), S (M3), and G2/M (M4) phases calculated using flow cytometry. The data gatings are indicated for each DNA histogram for M1, M2, M3 and M4. The percentage of cells with a DNA content less than G1 (sub-G1) is indicated in each histogram. The cell cycle profiles shown, with the sub-G1 population indicated, are representative of three experiments performed. (D) Cell cycle profile (Sub-G1) summarized using a histogram. MDA-MB-231 and A549 cells were treated with different doses of Pimozide for 24 hours, and the percentage of cells in the sub-G1 phase of the cell cycle (dead and dying cells) was quantitated by flow cytometry. Data shown are means ± SD of three independent experiments, **, P < 0.01, Student’s t-test. (E & F) DNA damage response (DDR) measured after treatment with Pimozide, Doxorubicin (Doxo) and Paclitaxel (Pac). (E) Representative fields of DAPI-stained DNA showing nuclear damage after 7.5 μM Pimozide treatment. Some nuclei show signs of dynamic DNA membrane blebbing (white arrow) and fragmentation after treatment for 48 hours, whilst other nuclei remained unchanged. There is also fragmented DNA outside (red arrow), and inside the nucleus (yellow arrow) suggesting chromatin condensation after treatment. Magnification 200x. Scale bar 10 μm. (F) Staining for histone γH2AX in MDA-MB-231 cells treated with 7.5 μM Pimozide or with 2.5 μM Doxorubicin or 100 nM Paclitaxel for 24 hours, images are representative of three experiments performed. Magnification 200x for DMSO and Pimozide treatment. Scale bar 10 μm. Magnification 400x. Scale bar 10 μm for Doxorubicin and Paclitaxel treatment. Pimozide reduced the protein and RNA expression of AKT and Ran, as well as RNA expression of cMYC and cMET. (G) Western blotting analysis of Caspas-3 in MDA-MB-231 treated with Pimozide at different doses for 24 hours. β-Actin was used as a loading control. Data shown are representative of three experiments performed. (H) Western blotting analysis of PARP in MDA-MB-231 treated with Pimozide at different doses for 24 hours. β-Actin was used as a loading control. Data shown are representative of three experiments performed. (I) Western blotting analysis of Ran, AKT1, AKT2 and pAKT in MDA-MB-231 treated with Pimozide at different doses for 24 hours. β-Actin was used as a loading control. Data shown are representative of three experiments performed. (J) Relative mRNA expression of all AKT isoforms in MDA-MB-231 cells either untreated or treated with Pimozide 7.5 μM for 24 hours. Data shown are representative of three experiments performed. (K) Relative mRNA expression of Ran, c-MYC and c-MET in MDA-MB-231 cells treated with 7.5 μM Pimozide for 24 hours. Data shown are representative of three experiments performed.


