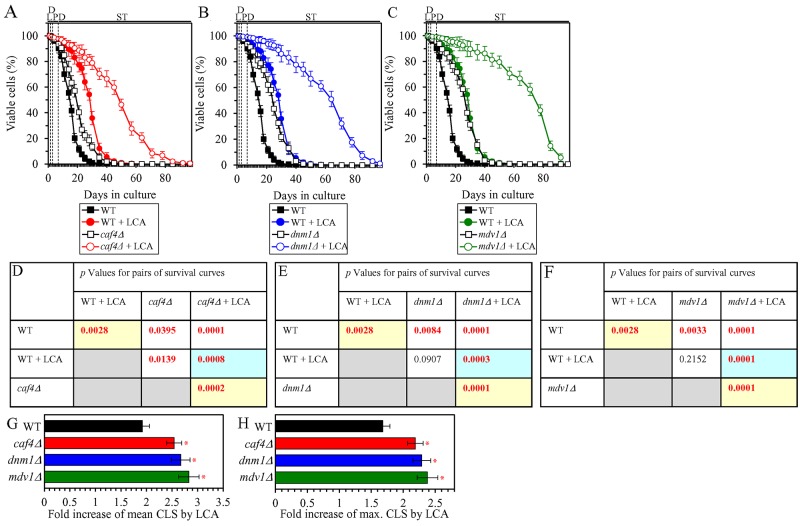
Figure 11. Under CR conditions in the presence of LCA, lack of the Caf4, Dnm1 or Mdv1 protein component of the mitochondrial fission machine increases the efficiency of yeast CLS extension by LCA.
WT cells and mutant cells carrying a single-gene-deletion mutation eliminating either the Caf4, Dnm1 or Mdv1 protein were cultured in the nutrient-rich YP medium initially containing 0.2% glucose with 50 μM LCA or without it. (A, B, C) Survival curves of the chronologically aging WT and caf4Δ (A), WT and dnm1Δ (B) or WT and mdv1Δ (C) strains are shown. Data are presented as means ± SEM (n = 3). Data for the WT strain cultured with or without LCA are replicated in graphs A, B, C of this Figure. (D, E, F) p Values for different pairs of survival curves of the WT and caf4Δ (D), WT and dnm1Δ (E) or WT and mdv1Δ (F) strains cultured with or without LCA. Survival curves shown in (A, B or C, respectively) were compared. Two survival curves were considered statistically different if the p value was less than 0.05. The p values for comparing pairs of survival curves using the logrank test were calculated as described in Materials and Methods. The p values displayed on a yellow color background indicate that LCA extends the CLS of the WT, caf4Δ (D), dnm1Δ (E) and mdv1Δ (F) strains. The p values displayed on a blue color background in D, E and F indicate that LCA extends the CLS of the caf4Δ (D), dnm1Δ (E) and mdv1Δ (F) strains to a higher extent than that of the WT strain. (G, H) Survival curves shown in (A, B, C) were used to calculate the fold of increase of the mean (G) and maximum (H) CLS by LCA for the WT, caf4Δ, dnm1Δ and mdv1Δ strains. Data are presented as means ± SEM (n = 3; *p < 0.05). Abbreviations: L, D, PD and ST, logarithmic, diauxic, post-diauxic and stationary growth phases (respectively).

