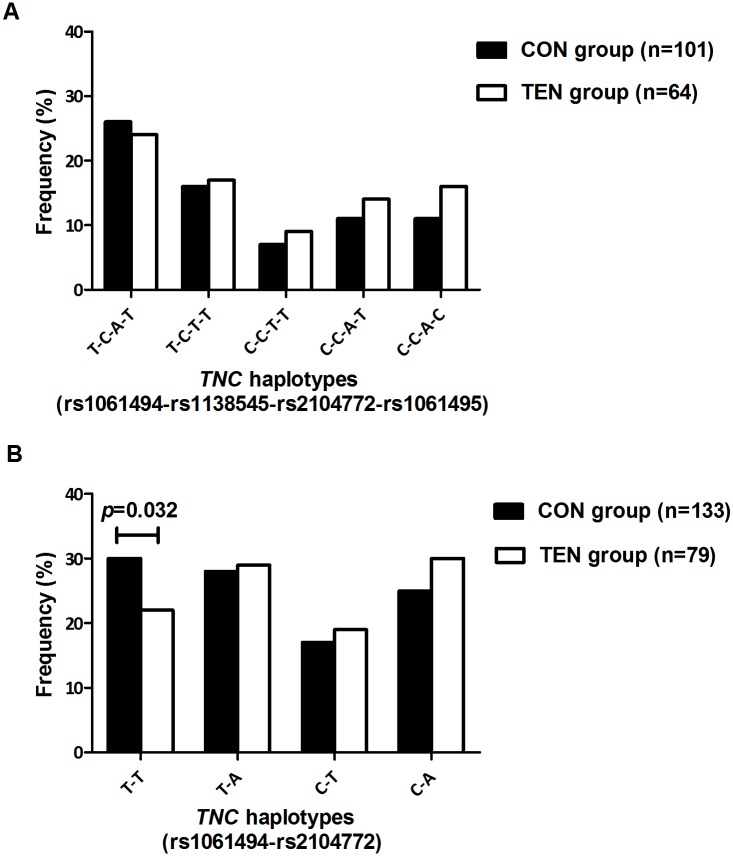
Fig 5. Frequency distribution of TNC haplotypes in the Achilles tendinopathy sample group.
(A) Frequency distribution of the inferred haplotypes constructed from the TNC rs1061494, rs1138545, rs2104772 and rs1061495 variants in the Achilles tendinopathy sample group. (B) Frequency distribution of the inferred haplotypes constructed from the TNC rs1061494 and rs2104772 variants in the Achilles tendinopathy sample group. CON: Control participants; TEN: Achilles tendinopathy cases. Statistically significant differences in haplotype frequency between the groups are depicted on the graph, with p-values adjusted for age and sex. The number of participants (n) in each group is in parentheses.

